
The Laws of Demand and Supply form the cornerstone of market economics, offering a fundamental framework for the determination of prices in the marketplace. These laws help explain the interaction between consumers and sellers and the availability of goods and services in an economy. This article of NEXT IAS aims to explain the laws of demand and supply and related concepts such as elasticity of demand and supply, types of goods, and market equilibrium among others.
What is Demand?
Demand, in the context of economics, refers to the quantity of goods and services that a consumer is willing and able to buy.
Determinants of Demand
The demand for a particular commodity in an economy depends on several factors, such as:
- Price of the commodity.
- Price of the other related goods.
- Income of consumers.
- Tastes and preferences of consumers.
- Size of the market i.e. the number of consumers, etc.
Demand Curve
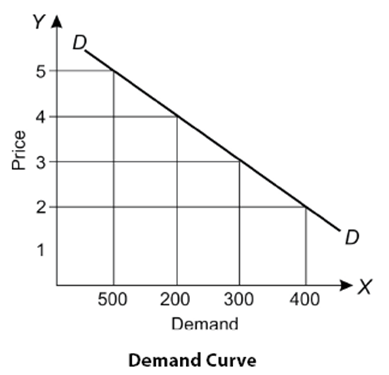
- Demand Curve is the graphical representation of the relationship between the price of a commodity and the quantity of the commodity demanded.
- The independent variable (Price) is represented along the Y-axis and the dependent variable (Quantity) is represented along the X-axis.
- The demand curve, usually, moves downward from the left to the right.
Income Effect and Substitution Effect
Income Effect
The income effect represents the change in an individual’s or economy’s income and its impact on the quantity demanded of a good or service. Usually, with an increase in income, an individual demands more goods and services, other things remaining constant.
Substitution Effect
The substitution effect occurs when a consumer replaces one commodity with another due to a change in relative prices and/or personal income. This includes replacing cheaper items with those more expensive, or vice versa.
Difference between Income Effect and Substitution Effect
The income effect refers to a change in demand for a commodity due to a change in income. The substitution effect, on the other hand, shows the change in demand for a product due to a relative change in price and the availability of substitutable products.
The prominence of these effects, usually, depends on the market scenario as can be seen as follows:
- In a market with few choices or substitutes, a rise in the price of a commodity may show the income effect more prominently.
- In such a scenario, consumers may stop buying the commodity altogether.
- In a market with multiple substitution options, a rise in the price of a commodity may show the substitution effect more prominently.
- In such a scenario, consumers can choose to buy a similar but more affordable product.
Law of Demand
The Law of Demand states that the other factors remaining constant, price and quantity demanded of any good or service are inversely related to each other. In other words, when the price of a product increases, the demand for the product will fall and vice versa.
Assumptions to Law of Demand
The demand for a commodity depends on multiple factors and not just the price. However, in order to put things simply, the Law of Demand makes some assumptions as explained below:
- Income of the consumer remains constant: Usually, the demand for a particular commodity increases with the increase in income of the consumer and vice versa. This, in turn, can affect the demand curve. However, the Law of Demand assumes that the income of the consumer remains constant for the time being.
- Tastes and preferences of the consumer don’t change: A change in taste and preference of the consumer in favor of a particular commodity, usually, increases the demand for that commodity and vice versa. However, the Law of Demand assumes that for the time being the taste and preference of the consumer remains constant.
- Size and composition of population remain constant: An increase/decrease in population would increase/decrease the number of consumers and hence increase/decrease the demand for a particular commodity. Similarly, any change in the composition of the population means that the needs of the population change and so does the demand for the commodity. Hence, the Law of Demand assumes that these two population variables remain constant.
Exceptions to the Law of Demand
Giffen Goods
- A Giffen good is a good for which demand increases as the price increases, and falls when the price decreases. Thus, for a Giffen good, the demand curve is an upward-sloping demand curve, which is contrary to the Law of Demand.
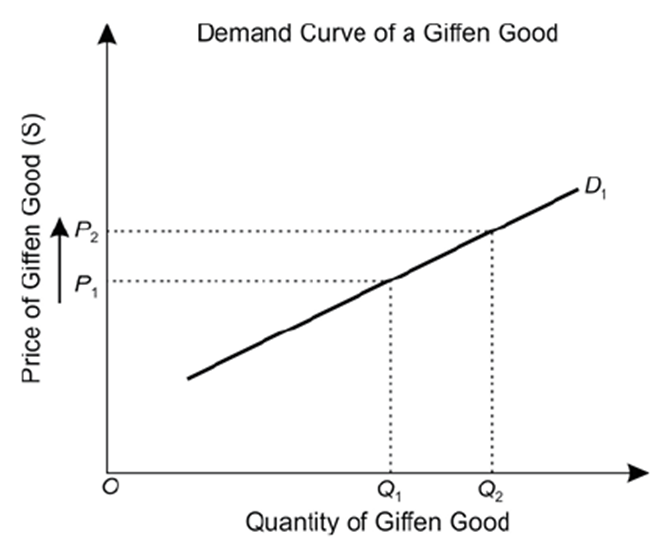
- A Giffen good is typically an inferior good that does not have easily available substitutes. Thus, in this case, the income effect dominates the substitution effect.
- Staple foods are an example of Giffen Goods.
- They are consumed by poor people who are unable to afford superior foods.
- As the price of superior foods increases, they become unaffordable to more people, who then resort to Giffen Goods. Thus, demand for Giffen Goods (staple food) increases.
Veblen Goods
- A good for which demand increases as the price increases, because of its exclusive nature and appeal as a status symbol. Thus, just like Giffen goods, the demand curve for Veblen goods is upward-sloping, which is contrary to the Law of Demand.
- However, unlike Giffen goods, a Veblen good is generally a high-quality, coveted product.
Demand Elasticity (DE)
- Demand elasticity refers to how sensitive the demand for a good is to changes in other economic variables, such as prices and consumer income.
- Demand elasticity is calculated by taking the percent change in the quantity of a good demanded and dividing it by a percent change in another economic variable.
- There can be 2 cases w.r.t. demand elasticity for a particular economic variable:
- Demand Elasticity > 1 – it is called elastic demand.
- In this case, the demand reacts proportionately higher to changes in a particular economic factor.
- For example, a 1% change in price or income leads to more than 1% change in demand.
- Demand Elasticity < 1 – it is called inelastic demand.
- In this case, the demand reacts proportionately lower to changes in an economic variable.
- For example, a 1% change in price or income leads to less than 1% change in demand.
- Demand Elasticity > 1 – it is called elastic demand.
Types of Demand Elasticity
Based on economic variables being used, there are various types of Demand Elasticity:
- Cross Elasticity of Demand or Cross-Price Elasticity of Demand
- Price Elasticity of Demand
- Income Elasticity of Demand
Cross Elasticity of Demand or Cross-Price Elasticity of Demand
- It is a measure of the responsiveness of the demand for a good towards the change in the price of a related good.
- Based on Cross Elasticity of Demand, related goods are of two kinds – Substitute goods and Complementary Goods.
Substitute Goods
- Two related goods are called Substitute Goods if their cross elasticity of demand is positive.
- In this case, the demand for one good increases if the price for the other good increases.
- This happens because an increase in the price of one good reduces its demand, forcing the consumers to shift to the other good, which happens to be the substitute for the first good.
- For example, Tea and Coffee.
- If the price of Coffee increases, the demand for tea increases.
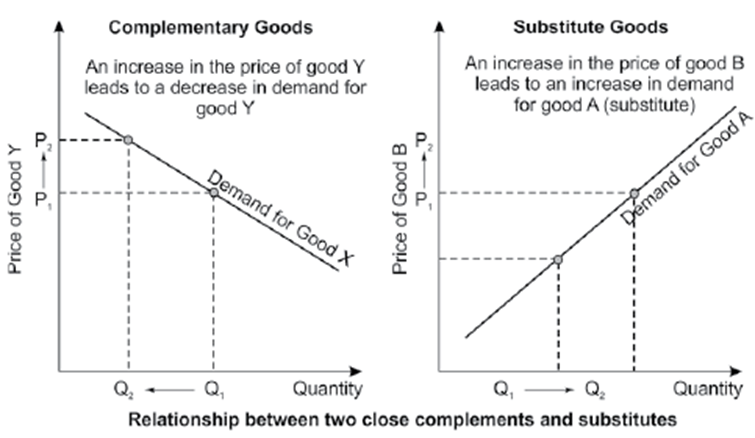
Complementary Goods
- Two related goods are called Complementary Goods if the cross elasticity of their demand is negative.
- In this case, the demand for one good decreases if the price for the other good increases.
- This happens because the complementary goods are consumed together i.e. one good cannot be consumed without the other. Thus, a price rise and hence reduced demand for one good reduces the demand for the other good as well.
- For example, Pen and Ink.
- If the price of a Pen increases, the demand for ink decreases.
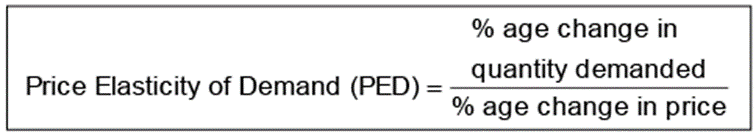
Price Elasticity of Demand
- It is a measure of the rate of change in the quantity demanded of a particular good in relation to a change in its price.
- There can be the following types of Price Elasticity of Demand (PED)
- PED = 0: Demand is perfectly inelastic.
- In this case, the consumers do not respond to the increase or decrease in the price of a good, and the demand remains unchanged.
- This happens, usually, with items of necessity, such as Insulin for a Diabetic patient, etc.
- PED < 1: Demand is relatively inelastic.
- In this case, the percent change in demand is less than the percent change in price.
- For example: petrol, salt, goods produced by a monopoly, etc.
- PED = 1: Demand is unit elastic.
- In this case, the percent change in demand is equal to the percent change in price.
- This, usually, occurs with goods that have close substitutes or alternatives, like clothing brands, consumer goods etc.
- PED > 1: Demand is relatively elastic.
- In this case, the percentage change in the quantity demanded of a product is greater than the percentage change in price.
- For example: fast-moving consumer goods, Newspapers, consumer goods like tomato ketchup, chocolates, etc.
- PED = ∞ (Infinity): Demand is perfectly elastic.
- In this case, the demand is affected to a greater degree by changes in price.
- For example: Luxury Goods, anything with a close and large number of substitutes.
- PED = 0: Demand is perfectly inelastic.
Income Elasticity of Demand
- Income elasticity of demand is a measure of the rate of change in the quantity demanded of a particular good in relation to the change in income of consumers.

- There can be the following types of Income Elasticity of Demand (IED)
- IED > 0
- In this case, the quantity demanded for a commodity increases with the rise in income of the consumer and vice versa.
- For example: As the income of consumers increases, they consume more of superior (luxurious) goods and vice versa.
- IED < 0
- In this case, the quantity demanded for a commodity decreases with the rise in income of the consumer and vice versa.
- For example: As the income of consumers increases, they either stop or reduce consumption of inferior goods.
- IED = 0
- In this case, the quantity demanded for a commodity remains constant with any rise or fall in the income of the consumer.
- This, usually, happens with the basic necessary goods such as salt, kerosene, electricity, etc.
- IED > 0
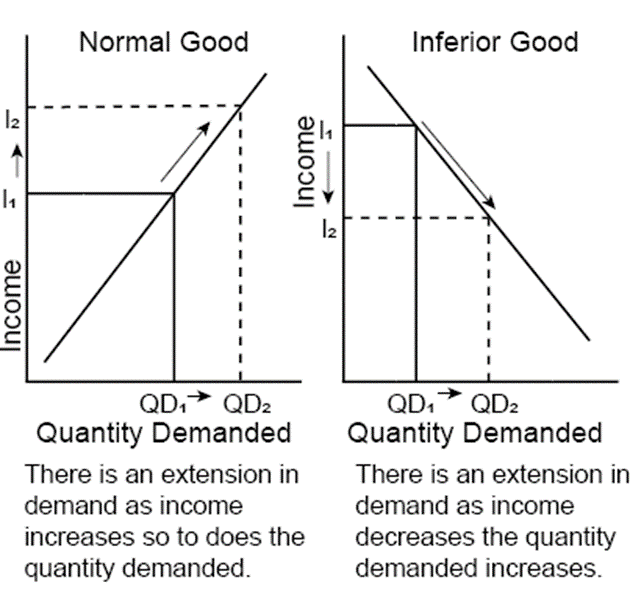
- Based on the value of the Income Elasticity of Demand, goods can be broadly categorized into two types – Normal Goods and Inferior Goods.
Normal Goods
- Normal Goods are those goods that have a positive Income Elasticity of Demand (IED).
- Thus, for these goods, as the income of the consumer rises, more goods are demanded, and vice versa.
Necessity Goods
- Necessity Goods are those Normal Goods whose Income Elasticity of Demand (IED) is between zero and one.
- They are, basically, products and services that consumers will buy regardless of changes in their income levels.
- Examples: staple foods, electricity, etc.
Inferior Goods
- Inferior goods are those goods that have a negative Income Elasticity of Demand (IED).
- Thus, for these goods, as the income of the consumer increases, fewer goods are demanded, and vice versa.
- Examples: low-quality food items like coarse cereals.
What is Supply?
Supply, in the context of economics, refers to the total amount of a specific good or service that is available to consumers.
Determinants of Supply
The supply of a particular commodity in an economy depends on several factors, such as:
- Price of the commodity.
- Price of the other related goods.
- Number of sellers in the market.
- Sellers’ price expectations.
- Level of production
- State of technology, etc.
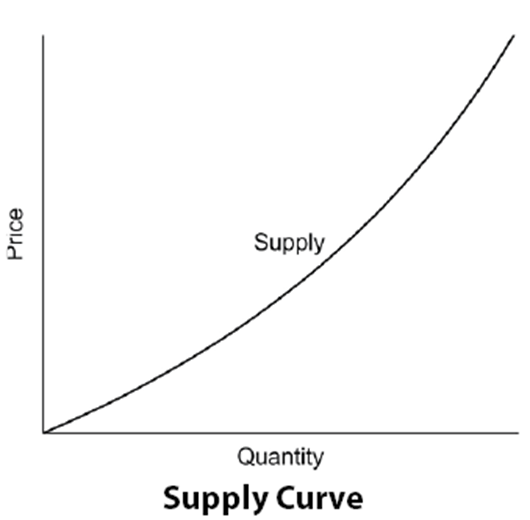
Supply Curve
- Supply Curve is the graphical representation of the relationship between the price of a commodity and the quantity of the commodity that a seller is willing and able to supply.
- The independent variable (Price) is represented along the Y-axis and the dependent variable (Quantity) is represented along the X-axis.
- The Supply Curve, usually, rises upward from left to right.
Law of Supply
The Law of Supply states that the other factors remaining constant, price and quantity supplied of any good or service are directly related to each other. In other words, when the price paid by buyers for a good rises, then suppliers increase the supply of that good in the market.
Assumptions to Law of Supply
The supply of a commodity depends on multiple factors and not just the price. However, in order to put things simply, the Law of Supply makes some assumptions as explained below:
- Cost of Production Remains Constant: Any change in the cost of production will change the price of the product and hence its supply in the market. However, the Law of Supply assumes that the cost of production remains constant for the time being.
- Technology Remains Constant: Any change in technology used for production will affect the price of the product and hence its supply in the market. Thus, to keep aside this effect, the Law of Supply assumes that the technology employed for production remains constant.
- Transport Cost Remains Constant: Any change in transport cost will lead to a change in the total cost of production, thus affecting the supply of a commodity. Hence, the Law of Supply assumes that the transport cost remains constant.
- Prices of Related Goods Remain Constant: Any change in the price of the related goods (Substitute Goods and Complementary Goods) would mean that the producer will be inclined to produce the commodity that has a higher price. This will affect the supply of the commodity. Hence, the Law of Supply assumes that prices of related goods remain constant.
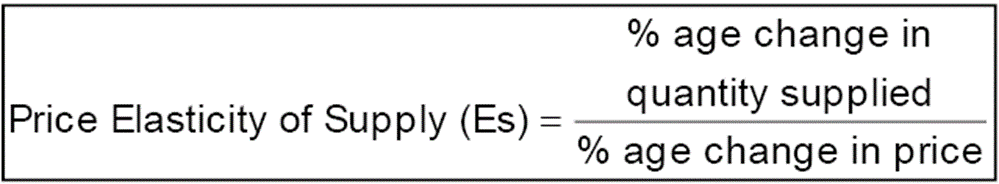
Price Elasticity of Supply
- The Price Elasticity of Supply measures the responsiveness of quantity supplied to changes in the price of any good or service.
- There can be the following types of Price Elasticity of Supply
- Elastic Supply (Es > 1): Supply is said to be elastic when a given percentage change in price leads to a larger change in quantity supplied.
- Inelastic Supply (Es < 1): Supply is said to be inelastic when a given percentage change in price causes a smaller change in quantity supplied.
- Unit Elasticity of Supply (Es = 1): If the price and quantity supplied change by the same magnitude, then we have unit elasticity of supply.
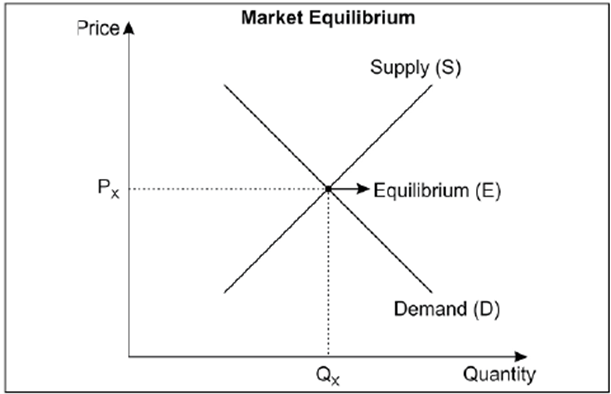
Market Equilibrium
- Market Equilibrium refers to a state in which the supply of a particular commodity and its demand becomes equal.
- The market forces, automatically, drive both the producers and the consumers to the price at which Demand Curve and Supply Curve intersect each other.
- The price at which the Market Equilibrium is achieved is called the “Equilibrium Price” or “Market-Clearing Price”.
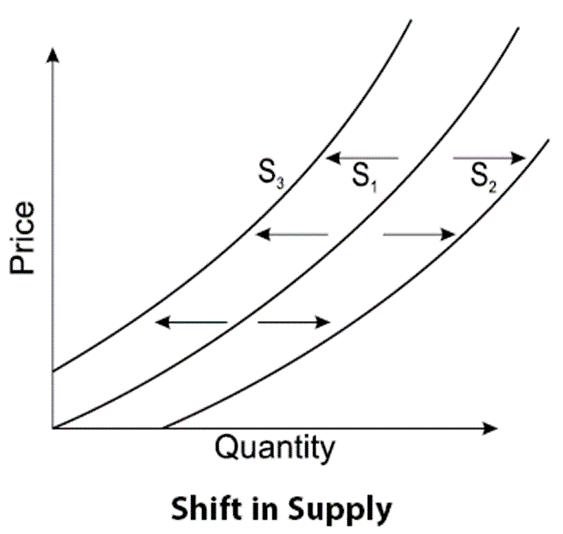
Shifts in Demand and Supply
If, for any reason, there is a shift from the equilibrium supply or demand, the market equilibrium gets disturbed. In such cases, market forces, automatically, work in such a manner to bring the supply and demand to a new equilibrium point.
This automatic mechanism of the market to achieve a new equilibrium point can be seen as follows:
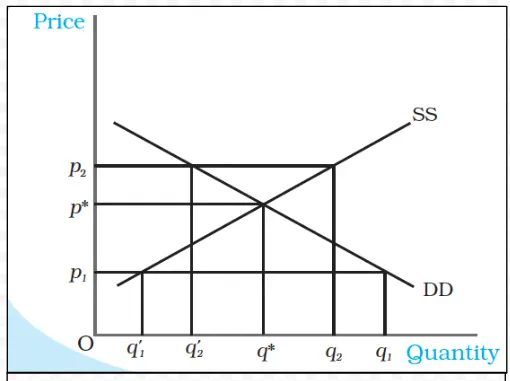
Excess Demand
If market demand exceeds market supply at a price, excess demand exists in the market at that price.
Suppose, the prevailing price is p1, at which the market demand is q1, whereas the market supply is q1’. Thus, there is excess demand in the market, equal to q1’q1. Since the supply lags behind the demand in such a situation, some consumers will be unable to obtain the commodity or obtain it in insufficient quantity.
Such consumers will be willing to pay more than the prevailing price p1 to get the commodity. This will increase the market price of the commodity, thus reducing its demand and increasing its supply. As a result, the market moves towards the point where the supply becomes equal to the demand (both q*).
Excess Supply
If at a given price, the market supply is greater than the market demand, there is an excess supply in the market at that price.
Suppose, the prevailing price is p2, at which the market supply is q2, whereas the market demand is q2’. Thus, there is an excess supply in the market, equal to q2’q2. Since the demand lags behind the supply in such a situation, some firms will not be able to sell their goods.
Such firms will lower their selling price to sell the pending inventory. This will reduce the market price of the commodity, thus increasing its demand and reducing its supply. As a result, the market moves towards the point where the supply becomes equal to the demand (both q*).
The Law of Demand and Supply is fundamental to economic theory, offering essential insights into how markets operate. By explaining the relationship between prices, quantities demanded, and quantities supplied, these principles help explain a wide range of economic phenomena and inform decision-making by consumers, producers, and policymakers alike.
GS - 3


