Inflation is a complex economic phenomenon that can impact from the government to the common people. A good grasp of the concept and related aspects is essential to understanding its implications in economic dynamics. This article of NEXT IAS aims to study in detail the concept of inflation, its meaning, types, measures, effects, and other related concepts such as price level, price index, Phillips Curve, and more.
What is Inflation?
- It refers to a steady rise in the prices of various goods and services in the economy.
- It is measured on a year-on-year basis.
- For example, an inflation of 6% in April 2024 means prices of goods and services have increased by 6% when compared to the prices in April 2023.
- It is usually expressed as a rate as follows:
Rate of Inflation = (Price in this Period – Price in the Previous Period) X 100/Price in the Previous Period
- It is measured through the Price Index (the concept of the Price Index is explained in detail in the sections below).
Types of Inflation
It can be categorized on the basis of its rate as well as its causes. Different types of inflation based on these two parameters have been explained in detail in the sections that follow.
Types of Inflation based on Rate
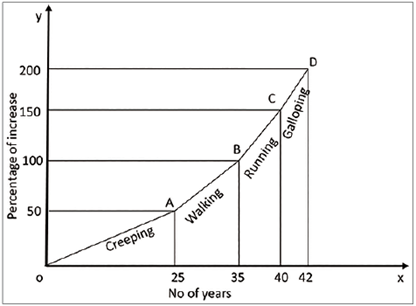
Depending on the rate of rise in prices, there are 4 types of inflation as explained below.
Creeping Inflation or Mild Inflation or Low Inflation
- As the name suggests, this type of inflation creeps, which means that the rise in prices is slow but continuous.
- Generally, the rate of price rise between 2 percent and 3 percent is categorized as Creeping Inflation.
- This inflation is manageable and is, generally, considered good for the growth of the economy.
- At this rate of price rise (2 percent to 3 percent), the producers and traders make reasonable profits, which encourages them to invest more.
Walking Inflation or Trotting Inflation
- When the rate of rise in prices is more than that in Creeping Inflation, then it is called Walking Inflation or Trotting Inflation.
- Generally, the range of this inflation is between 3 percent to 10 percent.
- It must be taken by the government as a wake-up call as, if not checked, it may lead to Running Inflation or Galloping Inflation.
Galloping Inflation or Hopping Inflation or Running Inflation
- When the rate of price rise is more than 10 percent and below 50 percent, it is known as Galloping Inflation.
- Due to this high level of price rise, businesses and employees’ incomes cannot keep up with the costs and prices.
- Investors also refrain from investing in economies with this high level of inflation.
Hyperinflation
- It is an extreme form of inflation where the prices rise at an alarmingly high rate, usually more than 50 percent per month.
- Usually, it occurs when there is a large increase in the money supply.
- Hyperinflation, in its extreme situations, means that the value of domestic currency reduces to almost zero and even to buy a loaf of bread, one needs to carry money in big bags.
- Thus, money almost ceases to be a store of value as well as a medium of exchange.
- The most recent phenomena of Hyperinflation are those in Zimbabwe during 2004-09 and in Venezuela in 2019.
Types of Inflation based on Causes
Based on the underlying causes, inflation is, broadly, categorized into the following types.
Demand-Pull Inflation
- A rise in prices of goods and services due to an increase in aggregate demand and consumption is called Demand-Pull Inflation.
- The underlying reason for this type of inflation is, usually, the increased disposable income in the hands of households, thereby increasing their demands for goods and services.
- This, in turn, means that while the aggregate supply of goods and services remains the same, their aggregate demand increases sharply, thus raising their prices.
Cost-Push Inflation
- A rise in prices of goods and services due to an increase in the cost of ‘factors of production’ i.e. land, labor, capital, and entrepreneurs is called Cost-Push Inflation.
- The underlying reason for this type of inflation is the increased cost of one or more inputs of production (i.e. land, labor, capital, and entrepreneurs). For example, a rise in the wage of labor.
- As a result of this, the overall cost of production of the good/service increases, and hence its price in the market increases.
Supply-Shock Inflation
- A rise in prices of goods and services due to either an unexpected or unforeseen sharp fall in the supply of commodities is called Supply-Shock Inflation.
- It is called “Supply-Shock” because its causal factors lie out of the control of either the firms or the workers.
Structural Inflation or Bottleneck Inflation
- A rise in prices of goods and services due to deficiencies existing in the economy such as inefficient storage and distribution facilities, poor productivity, etc is called Structural or Bottleneck Inflation.
- These deficiencies lead to shortages of supply of the good/service, which, in turn, results in its increased price.
- Tackling it Hence, the Government faces a tough time tackling this type of inflation.
Protein Inflation
- It is generally caused by the changing dietary habits of the population of a country due to the increase in income.
- As more and more people include protein-rich items such as milk, pulses, meat, fish, etc., it increases the demand and hence the prices of these items.
Measures of Inflation
- To effectively monitor and control the level of inflation in an economy, policymakers use various kinds of instruments.
- In India, inflation is mainly measured through 2 price indices – the Wholesale Price Index (WPI) and the Consumer Price Index (CPI).
- Another measure of inflation frequently used across the world is – GDP Deflator.
All these measures of inflation are discussed in detail in the sections that follow.
Price, Price Level, and Price Index
What is Price?
- The price of a good or service is defined as the rate at which that good or service is exchanged for money.
- In other words, the price of a good or service is the amount of money received for selling or, paid for buying, one unit of that good or service.
What is Price Level?
- The term Price Level refers to the average price or cost of all goods and services offered for sale in an economy.
- Measurement of price level allows economists to monitor changes in prices over a period of time.
What is Price Index?
- A Price Index is a statistical measure that reflects the average change in prices over time for a basket of goods and services.
- It is expressed with reference to a particular period, called the Base Year.
- A base year is selected and its index is assumed as 100. On its basis, the price index for other periods is calculated.
Price Index = (Current Year’s Price/Base Year’s Price)x100.
- Price Indices are used to measure the level of inflation.
- The same is explained in the sections that follow.
Wholesale Price Index (WPI)
- The Wholesale Price Index (WPI) measures the average change in the price of commodities traded in the wholesale market.
- In other words, the Wholesale Price Index (WPI) measures the average change in the prices of commodities for bulk sale at the level of the early stage of transactions in the domestic markets of India.
- It covers 3 commodity groups:
- Primary Products
- Fuel, and Power
- Manufactured Products
Thus, the WPI basket does not cover Services.
- The prices tracked are ex-factory prices for manufactured products, mandi prices for agricultural commodities, and ex-mines prices for minerals.
- Weights given to each commodity covered in the Wholesale Price Index (WPI) basket are based on the value of production adjusted for net imports.
- It is compiled and released by the Office of Economic Advisor, Ministry of Commerce and Industry on a monthly basis.
- The Base year for WPI is – 2011-12.
Consumer Price Index (CPI)
- The Consumer Price Index (CPI) measures the average change in prices paid by ultimate consumers for a particular basket of goods and services over a period of time.
- In other words, the Consumer Price Index (CPI) measures changes over time in the general level of prices of goods and services that households acquire for the purpose of consumption.
- Because of the different socioeconomic conditions of consumers, various types of Consumer Price Indices (CPIs) are calculated in India.
CPI for Industrial Workers (CPI-IW)
- CPI for Industrial Workers (CPI-IW) measures the change in the price of commodity basket consumed by the industrial workers.
- It is compiled and released by the Labor Bureau, Shimla, Ministry of Labor on a monthly basis.
- Base Year for CPI-IW is – 2016.
- It is used for wage indexation in government and organized sectors.
CPI for Urban Non-Manual Employees (CPI-UNME)
- CPI for Urban Non-Manual Employees (CPI-UNME) measures the change in the price of commodity baskets consumed by nonmanual employees like officegoers.
- Now, it has been discontinued.
- It was compiled by the Central Statistical Organisation (CSO), Ministry of Statistics and Programme Implementation on a monthly basis.
CPI for Rural Laborers and Agricultural Laborers (CPI-AL&RL)
- CPI for Rural Laborers and Agricultural Laborers (CPI-AL&RL) measures the change in the price of commodity baskets consumed by rural laborers.
- It is compiled and released by the Labor Bureau, Shimla, Ministry of Labor on a monthly basis.
- Base year for CPI-AL – 1986-87
- It is used for revising minimum wages for agricultural laborers in different states.
New Consumer Price Indices (CPIs)
- Old CPIs cover only a segment of the population such as agricultural laborers, industrial workers, etc, and hence, do not give a nationwide picture.
- Therefore, 3 new indices were introduced which cover all segments of the population of India.
- These new CPIs are compiled and published by the Central Statistical Organisation (CSO) for the All India Level as well as the State/UT Level.
- Base year for these new CPIs – 2012.
- The 3 new Indices have been described as follows:
CPI (Rural)
CPI (Rural) measures and tracks changes in the prices of goods and services consumed specifically by people living in rural areas.
CPI (Urban)
CPI (Urban) measures and tracks changes in the prices of goods and services consumed specifically by people living in urban areas.
CPI (Combined)
- CPI (Combined) is computed by combining CPI (Rural) and CPI (Urban).
- Based on the recommendations of the Urjit Patel Committee, the Reserve Bank of India (RBI) has started using CPI (Combined) as the sole inflation measure for the purpose of monetary policy.
Wholesale Price Index (WPI) Vs Consumer Price Index (CPI)
The difference between WPI and CPI can be understood through a comparative study between the two. The same is presented as follows.
| Basis | Wholesale Price Index (WPI) | Consumer Price Index-Combined (CPI (Combined)) |
|---|---|---|
| Base Year | 2011-12 | 2012 |
| Number of Commodities | Higher (around 697) | Lower (around 200) |
| Services | Not included. | Includes services. |
| Weightage of Food Products | Foot items have lesser weight (around 22%) | Foot items have greater weight (around 46%). |
| Level of Price Rise | The rate of WPI-based inflation is generally low compared to CPI-based inflation. | The rate of CPI-based inflation is generally high compared to WPI-based inflation. |
| Suitability as a Measure of Inflation | WPI is a less suitable measure of inflation and hence less suitable for making monetary policy decisions. | CPI is a more suitable measure of inflation and hence more suitable for making monetary policy decisions. |
Producer Price Index (PPI)
- The Producer Price Index (PPI) measures the average change over time in the selling prices received by domestic producers for their output.
- While the Wholesale Price Index (WPI) and Consumer Price Index (CPI) measure price changes from the perspective of buyers, the Producer Price Index (PPI) measures price changes from the perspective of producers.
GDP Deflator
- GDP Deflator refers to the ratio between GDP at Current Prices and GDP at Constant Prices.
- It can be calculated as:
GDP Deflator = GDP at Current Prices/GDP at Constant Prices
- By giving an idea about the changes in the level of prices, it acts as an indicator of the level of price rise.
- If the GDP Deflator = 1, it implies no change in the general price level.
- If the GDP Deflator > 1, it implies an increase in the general price level.
- If the GDP Deflator < 1, it implies a decrease in the general price level.
- As compared to WPI and CPI, GDP Deflator is a better measure of inflation as it takes into account all the goods and services of the economy.
- But, still, it is not used for short-term inflation targeting as GDP-related data are not available on a monthly basis.
Effects of Inflation
ITs effects on various sectors of the economy can be seen as follows.
- Redistribution of Income and Wealth: It leads to the redistribution of income and wealth from one hand to another. It results into loss to some group of people and gains to another group of people.
- Borrower (Debtor) Vs Lender (Creditor): The borrower (debtor) is the gainer, lender (creditor) is the loser.
- For example, suppose the debtor borrows 100/- at the interest rate of 5% per annum. So, he has to pay 105/- to the creditor next year. But, suppose inflation increases by more than 5% in a year, then what 100/- could buy this year cannot be bought by 105/- in the next year. So, the effective value of money for the creditor decreases.
- Producer Vs Consumer: The purchasing power of money held by consumers falls. So, they have to pay more money to producers for the same amount of goods and services. Thus, the producer is the gainer, and the consumer is the loser.
- Flexible Income Group Vs Fixed Income Group: Flexible income groups like sellers, self-employed etc, whose salary is adjusted according to inflation don’t get affected. On the other hand, fixed-income groups like daily-wage earners lose as the purchasing power of their fixed income falls.
- Debentures or Bond Holders Vs Issuers: Bond Issuers gain, and the bond-holders lose. This is because the fixed rate paid for the bonds is not enough to compensate for inflation.
- Equity Holders: The income of equity holders depends on the profit of the company. In an inflationary situation, companies earn more profit. So, equity holders also earn more income.
- Borrower (Debtor) Vs Lender (Creditor): The borrower (debtor) is the gainer, lender (creditor) is the loser.
- Effects on Production and Consumption
- A rise in prices leads to a fall in demand for goods and services. As a result, it may force a cut down in the production.
- It may also lead to a shift in investment from other sectors to those in which price rise has taken place. (as investors intend to make a higher profit)
- Other Effects of Inflation
- Savings: As inflation reduces the value of money, holding money is not a prudent economic decision. So, people would like to deposit money in the banks to negate the effect of inflation.
- Growth and Employment: In the short run, an increase in inflation is usually accompanied by an increase in economic growth and hence employment. But, in the long term, it does not necessarily hold true.
- Balance of Payment (BoP): High price reduces exports and increase imports from other countries where goods are available at a cheaper rate. It results in an unfavorable Balance of Payment (BoP).
- Exchange Rate: A high import and low export mean high demand for foreign currencies vis-a-vis domestic currency. This depreciates domestic currency.
- Social and Political Impacts: High level of prices leads to social and political tensions like strikes, dharnas, etc.
Measures to Control Inflation
Measures, usually, taken to control the price rise can be studied under the following heads.
- Monetary Measures
- The RBI uses monetary tools to reduce the money supply in the market. It leads to a reduction in demand, and hence prices.
- In some extreme situations, Demonetization of Currency (i.e. declaring a currency of a particular denomination as invalid) is done. It suddenly reduces the money supply in the market and hence demand for goods and services.
- Fiscal Measures
- Reduction in government expenditure, which helps reduce demand and hence brings down the price level.
- The government resorts to increasing direct taxes like Income Tax. It reduces the disposable income available to the people, thus leading to low demand and hence lower prices.
- The government may also resort to decreasing indirect taxes like Excise Duty, Sales Tax, etc. It, directly, brings down the prices of goods and services.
- The government may also pass a surplus budget, which means less expenditure than receipts. This reduces money supply and hence demand for goods and services.
- Trade Measures
- Various trade measures can be taken to tackle the shortage of goods in the domestic market, such as the import of goods from foreign countries. The higher supply helps to bring down the prices.
- Administrative Measures
- A rational Wage Policy helps to bring the cost of production and hence prices of goods and services under control.
- At times, the government may resort to direct price control by fixing maximum price limits through the Administered Price System or Subsidy Programs.
- The method of rationing (i.e. fixing quota for consumption of a particular good) helps keep the demand under control and hence reduces prices.
Inflation is an intricate part of the economic fabric influencing financial decisions and economic policies. Its effective management requires a careful balance of monetary policy, fiscal policy, and regulatory measures to maintain economic stability and promote sustained growth. By understanding and anticipating its causes and effects, governments, businesses, and individuals can better prepare and adapt to its inevitable challenges.
Related Concepts
Deflation
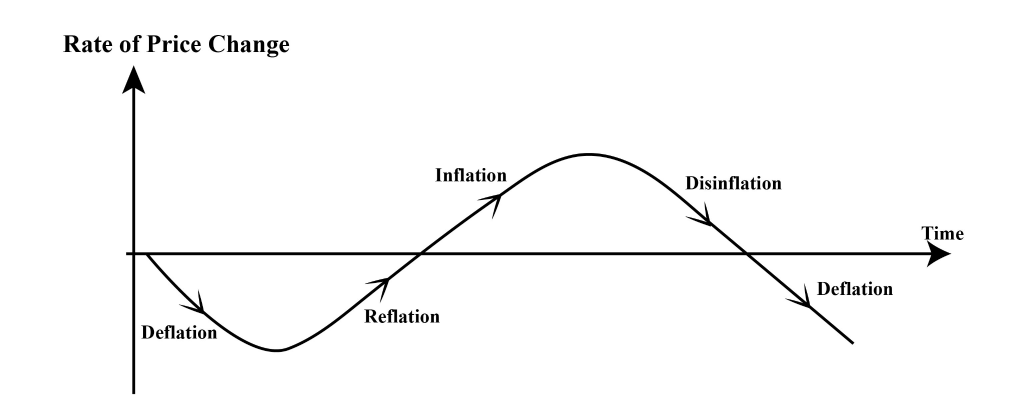
- Deflation refers to a persistent fall in the general level of prices.
- Thus, it is the opposite of Inflation.
- In this case, the rate of change of the price index is negative.
Disinflation
- It refers to a situation when the inflation occurs at a slowing pace.
- For example, if the rate of price rise in the last month was 6% and it is 5% in the current month, it will be called Disinflation.
Reflation
- Reflation refers to the deliberate action of the government to increase the rate of inflation to stimulate the economy.
- It is usually done to redeem the economy from a deflationary situation.
Core Inflation
- It is the measure of persistent increase in the general level of prices of goods and services excluding food and energy items (basically, the items whose prices are very volatile and temporary in nature).
- Since it excludes the items that are volatile w.r.t. their prices, it gives the long-term trend in price rise. Thus, it is helpful in framing the long-term policy.
Headline Inflation
- It refers to the total inflation within an economy, including all items that consumers buy.
- Thus, it reflects the rate of change in prices of all goods and services in an economy over a period of time.
- In the RBI’s newly adopted Flexible Inflation Targeting (FIT) framework, CPI (Combined) is used to calculate the Headline Inflation.
Stagflation
- The word ‘Stagflation’ is made up of two words, i.e., stagnation and inflation.
- It refers to an economic situation in which both Stagnation (i.e. very low economic growth) as well as price rise occur simultaneously.
- Usually, in normal situations, a higher rate of inflation is accompanied by a higher rate of economic growth.
- But, Stagflation is a rare phenomenon and is an exception to the “Phillips Curve”.
Skewflation
- It refers to a situation where there is an increase in the prices of only a few goods or a group of goods, while prices of other goods remain stable.
- Thus, it is different from inflation which involves a rise in prices of all goods and services.
- In India, it holds true for food items many times.
Inflationary Gap
- It is also known as an expansionary gap.
- It is the difference between the current level of real GDP and the anticipated GDP that would be experienced if an economy is at full employment.
- In other words, it is the amount by which actual aggregate demand exceeds the level of aggregate demand required to establish the full employment equilibrium.
Inflation Spiral or Price Wage Spiral
- It refers to a situation of a vicious circle wherein both wages and prices, reinforced by each other, keep on increasing.
- An increase in wages increases the demand and hence prices of goods and services. With aggregate supply remaining the same, the increase in the prices again increases the wages due to higher profits earned by entrepreneurs.
- Thus, it works like a spiral where wages and prices reinforce each other.
Inflation Premium
- It refers to an additional amount that investors require on the return of an investment to compensate for the risk of inflation.
- In order to negate the effect of inflation, investors calculate a “Real Interest Rate” by adjusting the “Nominal Interest Rate” for inflation.
- Accordingly, they charge the borrower on the real interest rate, and not on the nominal interest rate.
Inflation Tax
- It refers to an implicit tax caused by the effect of inflation on nominal assets, such as cash, bonds, and savings accounts.
- Printing and injecting more money into the market by the government creates an inflationary situation, which reduces the purchasing power of the money held by individuals.
- Thus, inflation acts like an explicit tax levied by the government as its effects are similar.
Phillips Curve
- It represents the inverse relationship between the unemployment rate and inflation.
- It says that there is an inverse relationship between the rate of inflation and the rate of unemployment in an economy.
- In other words, if unemployment decreases, inflation will increase and vice-versa.
- This curve is named after the economist A.W. Phillips, who first put forward this theory in 1958.
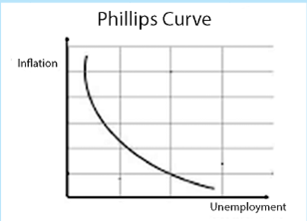
- Note: Stagflation is an exception to the theory proposed by the Phillips Curve.


