Syllabus: GS3/Economy
Context
- Economic inequality has sharply increased across the world, both between and within countries.
- In the Global South, as in the Global North, growth and inequality now seem to move together, as economic expansion often benefits higher-income groups more.
About Economic Inequality
- It refers to the unequal distribution of income, wealth, and opportunities among individuals or groups within and between societies.
- It manifests in differences in wages, access to resources, education, healthcare, and living standards.
- Some degree of inequality is inevitable in any economy, but excessive inequality can threaten social cohesion, political stability, and sustainable growth.
Types of Economic Inequality
- Income Inequality: It occurs when earnings from wages, investments, and transfers are distributed unevenly among individuals or households.
- The Gini coefficient is the most widely used measure, where 0 represents perfect equality and 1 (or 100%) represents extreme inequality.
- For example, countries like Denmark (Gini ≈ 0.25) show low inequality, while South Africa (Gini ≈ 0.63) faces severe inequality.
- Wealth Inequality: It deals with disparities in the ownership of assets — such as land, property, stocks, and savings.
- It is more extreme than income inequality because wealth accumulates over generations.
- According to the World Inequality Report (2026), the top 10% globally own three-quarters of all wealth, and bottom 50% hold just 2%; and top 1% control 37% of global wealth, 18 times more than the bottom half of the world combined.
- Opportunity Inequality: It reflects unequal access to education, healthcare, employment, and social mobility, and can reproduce inequality across generations even if income equality is achieved temporarily.
Measuring Income Inequality
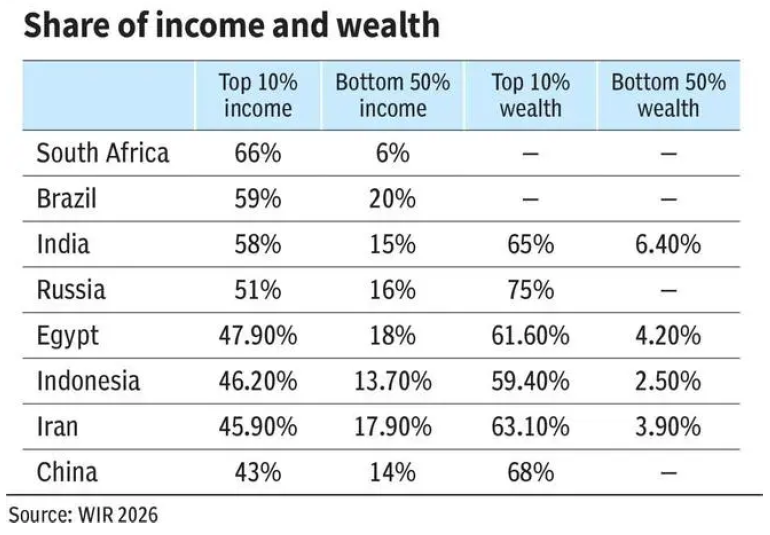
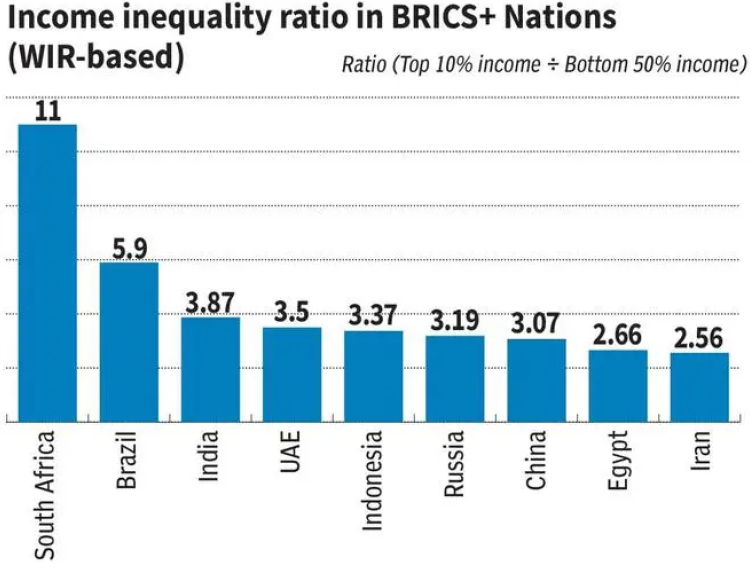
- A common way to assess inequality is through the income ratio between the top 10% and bottom 50%.
- In India, the income ratio stands at 3.87, meaning the top decile earns nearly four times what the bottom half earns.
- In India, the top 10% of earners hold a disproportionately large share of both income and wealth, and the bottom 50% hold only about 6% of total wealth.
- It is higher than in China or Russia, but lower than in Brazil and South Africa, where inequality is extreme.
Gini Coefficient: Diverging Trends
- Income vs. Consumption Gini: India’s consumption Gini coefficient (a measure of inequality based on household spending) fell to 0.255 in 2022–23, suggesting relatively equal consumption patterns.
- However, it understates true inequality, as it excludes income saved or invested and overlooks the wealth of the very rich.
- Income and Wealth Gini: According to the World Inequality Database, India’s income Gini rose sharply from 0.47 in 2000 to 0.61 in 2023, signaling deepening inequality.
- The top 1% of earners now capture a much larger share of national income and own around 40% of the nation’s total wealth.
Reasons of Inequality
- Declining Social Spending: The public spending on social sectors has not kept pace despite clear evidence of rising inequality.
- The social-sector spending has stagnated or declined, falling to 17% in 2024–25 and projected to reach only 19% in 2025–26.
- Social-sector spending includes health and education allocations, public health expenditure, and education spending.
- Uneven growth favoring high-skill and urban sectors.
- Jobless growth and rise of the gig economy, leading to precarious employment.
- Persistent inequality in access to education, healthcare, and credit.
- Wealth-income feedback, where high-income households accumulate more assets, further amplifying inequality.
Recent Policy Loophole
- Viksit Bharat – Guarantee for Rozgar and Ajeevika Mission (VB-GRAM) (Gramin): It replaces the MGNREGS, a demand-driven program providing guaranteed rural employment.
- VB-GRAM is supply-driven and depends heavily on state government funding, despite their limited fiscal capacity, unlike MGNREGS.
- The shift from MGNREGS to VB-GRAM risks worsening inequality by reducing income security for the rural poor.
- Reinstating a demand-based employment guarantee would be an essential first step in restoring economic balance.
Policy Responses and Fiscal Priorities
- Economic Survey (2024-25): It shows that India’s fiscal and structural policies have helped Gini coefficient decline in both rural and urban areas, indicating reduced inequality over recent years.
- Social Sector Spending: Government budgets have progressively increased social sector expenditure.
- Health: Government health expenditure increased from 29% to 48% of total health spending (reducing out-of-pocket burdens).
- Poverty & Healthcare: AB-PMJAY significantly reduced out-of-pocket healthcare expenditure for many households.
- Financial Inclusion & Welfare Transfers: Government programs explicitly designed to bring economically disadvantaged populations into formal financial and welfare networks:
- Pradhan Mantri Jan Dhan Yojana (PMJDY): Created bank accounts for millions, giving access to formal financial services and welfare benefits.
- Direct Benefit Transfer (DBT): Improved targeting and reduced ‘leakage’ in welfare delivery.
- Stand-Up India and PM Vishwakarma: Provide credit and support to Scheduled Castes / Scheduled Tribes / women entrepreneurs, enabling inclusive entrepreneurship.
- PM Garib Kalyan Anna Yojana (PMGKAY): Food security support to vulnerable households remains a key redistributive instrument.
- PM-KISAN: Income support to small and marginal farmers.
- Access & Digital Inclusion: India’s fiscal policy places priority on digital infrastructure and identity systems, e.g., Aadhaar linking for welfare delivery and market access.
- Linking to SDGs: India tracks representation and access metrics including gender and caste representation in governance under SDG 10 (‘Reduce inequality within and among countries’).
Way Forward: Towards Inclusive Growth
- India’s low household purchasing power constrains domestic demand and limits job creation. To achieve inclusive and sustainable growth, policies need to:
- Strengthen public employment programs.
- Expand social protection and welfare schemes.
- Increase wages and support to labor-intensive industries.
- Prioritize education, health, and rural infrastructure.
- A demand-driven approach that raises incomes of the bottom and middle classes is vital to sustain economic growth and reduce inequality.
| Daily Mains Practice Question [Q] Examine the recent trends in economic inequality in India. What are the key drivers behind this inequality, and how effective have government policies been in addressing it? |
Previous article
Legality of USA’s Venezuelan Actions