Syllabus: GS2/Social Issues; GS3/Inclusive Growth
Context
- The 3rd edition of the World Inequality Report highlights widening gaps in wealth, income, climate responsibility, and global financial flows, with India showing high levels of concentration at the top.
Key Findings of Report
- Global Inequality Trends: The top 10% globally own three-quarters of all wealth;
- The bottom 50% hold just 2%;
- The top 1% control 37% of global wealth, 18 times more than the bottom half of the world combined.
- Gender Inequality: Women earn only 61% of men’s income per working hour (excluding unpaid work).
- It falls to 32% if it includes unpaid labor.
- Globally, women capture just 26% of total labor income, a figure nearly unchanged since 1990.
- Regionwise Inequality: Middle East & North Africa (16%); South & Southeast Asia (20%); Sub-Saharan Africa (28%); East Asia (34%); Europe/North America/Oceania (around 40%);
- Climate Inequality: The report links economic inequality with environmental injustice:
- The poorest 50% of the global population account for only 3% of carbon emissions tied to private capital.
- The top 10% are responsible for 77%, and the top 1% alone account for 41%, nearly double that of the bottom 90% combined.
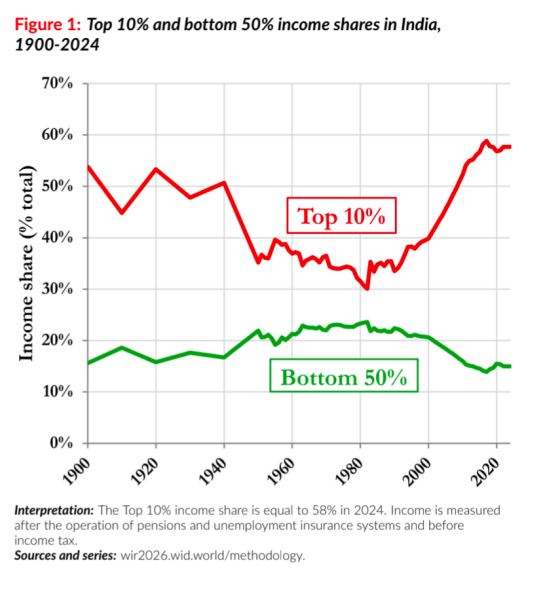
- Income Inequality in India: The top 10% in India earn 58% of the national income, while bottom 50% receive only 15%.
- Women earn just 18% of total labor income in India, below the global average of 34%.
- Wealth Concentration in India: Wealth inequality in India exceeds income inequality:
- The richest 10% own 65% of total wealth;
- The top 1% hold 40%;
- The bottom 50% own less than 6%.
Reasons Highlighted For Inequality
- Changing Global Economic Geography (1980 to 2025): In 1980, the global elite was concentrated in North America, Europe, and Oceania, while India, China, and Sub-Saharan Africa were largely confined to the bottom 50%.
- By 2025, China’s population has moved upward into the middle and upper-middle global income brackets.
- India has lost relative ground, with much of its population now concentrated in the bottom half of the global distribution.
- Policy Failures: The report highlights taxation failures at the very top, where the ultra-rich often pay lower effective tax rates than middle-income households.
- The regressive tax structure undermines state capacity to invest in public goods like education, healthcare, and climate action.
Key Suggestions in Report
- Progressive taxation to ensure those with greater means contribute fairly.
- Public investment in universal education, healthcare, childcare, and nutrition programs.
- Redistributive measures, including cash transfers, pensions, and unemployment benefits to directly reduce inequality.
Previous article
Deepavali Added to UNESCO Intangible Cultural Heritage List