Syllabus: GS3/Economy
Context
- Currency with the public has more than doubled since the demonetisation in 2016 was announced by the government.
Demonetisation
- The Prime Minister announced demonetisation on November 8, 2016.
- It declared that all existing Rs 500 and Rs 1,000 notes which together accounted for about 86% of the currency in circulation would cease to be legal tender.
- Demonetisation in 2016 was apparently intended to eliminate black money, curb counterfeit currency, promote digital payments and formalise the economy.
Currency with Public
- Currency with the public is arrived at after deducting cash with banks from total currency in circulation (CIC).
- CIC refers to currency notes and coins issued by the central bank within a country that is physically used to conduct transactions between consumers and businesses.
- Nine years after demonetisation the public currency remains high, although the government and the RBI have pushed for a less cash society.
- However, the size of the economy also expanded with a 6% plus growth every year, bringing the currency in circulation to GDP ratio below the pre-demonetisation level.
Does Rise in Currency Show the Real Picture?
- The rise in currency in circulation in absolute numbers is not the reflection of reality as GDP growth has remained strong and even touched 7.8% in the first quarter of FY2026.
- Since demonetisation in 2016, currency in circulation has risen steadily every year, with the CIC to GDP ratio having surged to 14.5% in 2020-21 from 8.7% in 2016-17.
- The ratio has now come down to 11.11% in 2025 from 12.1% in March 2016.
- A high CIC-to-GDP ratio indicates that people and businesses rely heavily on cash for transactions, while a lower ratio reflects a shift towards digital payments, banking channels and formal financial systems.
- A lower CIC-to-GDP ratio, driven by increased digitalization and reduced reliance on cash, generally enables smoother monetary policy transmission and better inflation control.
CIC-GDP Ratio of India compared to Other Countries?
- After the demonetisation and the Covid period, though India’s currency to GDP ratio has improved, it’s higher than other major economies.
- Japan has a ratio of 9-11%, Eurozone 8-10% and China 9.5%.
- Russia has a lower ratio of 8.3% and the US 7.96% .
- India’s elevated currency-to-GDP ratio of 11.11% stems from its sizable cash-dependent informal economy, a strong cultural preference for holding cash, limited card usage and comparatively lower adoption.
- At the same time India is also picking up fast digital payment systems, in contrast to the highly formalized and digitalised economies of the US, Eurozone, China and Russia.
India’s Money Supply Dynamics: Demonetisation to Digitisation
- Demonetisation (2016) triggered a short-term demand shock: MSME stress, job losses, and liquidity shortage. GDP growth briefly dipped below 6%.
- Digitisation surge: Post-2016, UPI transactions crossed ₹20 lakh crore/month (2025), expanding deep into Tier-2/3 towns, signalling substitution from cash for retail payments.
- Currency-to-GDP ratio: Fell from 12% in 2016 to around 10.5% in 2024, implying lower cash intensity though still above advanced economies due to a large informal sector.
| RBI’s Measures of Money Supply – Introduced in April 1977, the RBI classifies money supply into four aggregates — M1, M2, M3, and M4 — arranged by decreasing liquidity. 1. M1 (Narrow Money): Currency with the public + Demand deposits with banks (excluding inter-bank) + Other deposits with RBI. 2. M2: M1 + Post Office Savings Bank deposits. 3. M3 (Broad Money): M1 + Time deposits with commercial and cooperative banks. 4. M4: M3 + All Post Office deposits (both time and demand). 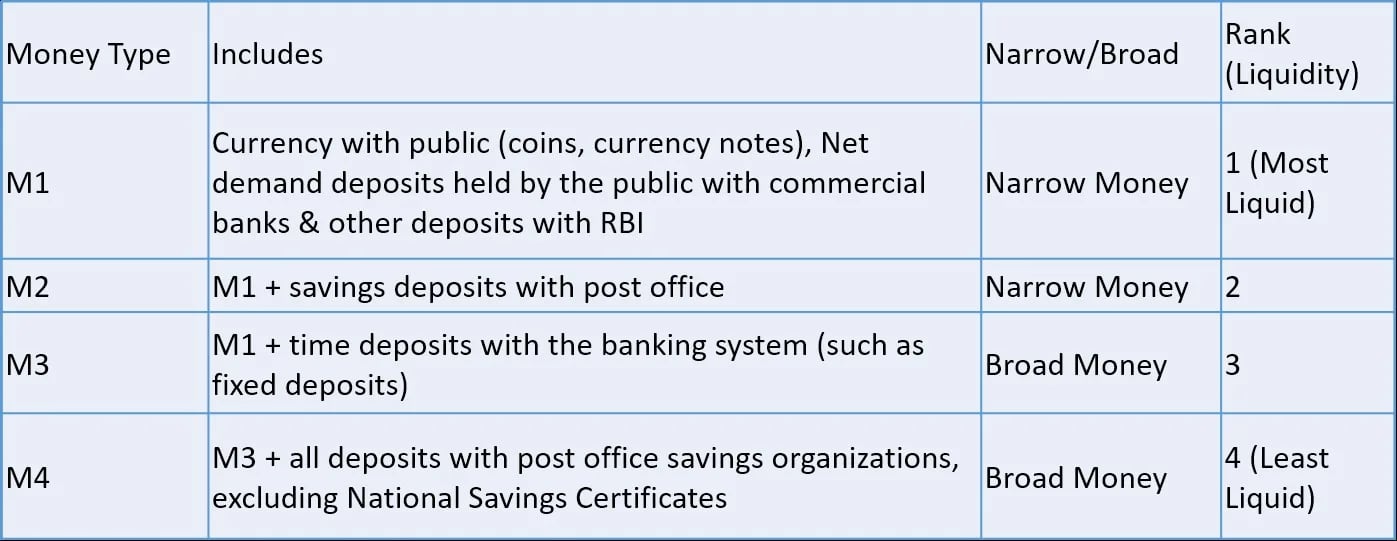 – Policy Use: Among these, M3 is the principal measure used by the RBI for monetary targeting and macroeconomic assessment, as recommended by the Chakravarty Committee (1982–85). Why M3 Matters? – It captures both currency and deposits that influence spending, saving, and credit creation. – It is more stable and reliable for medium-term policy analysis compared to narrower measures. – It reflects liquidity conditions affecting bank balance sheets and credit transmission. |
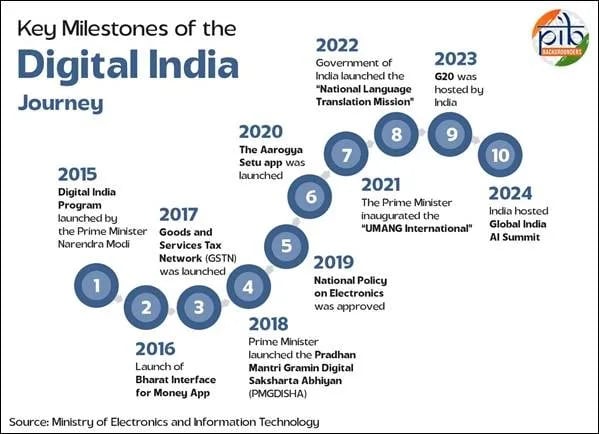
Digital Economy in India
- Post Demonitisation, the digital economy is growing fast, contributing 11.74% to the national income in 2022–23 and expected to reach 13.42% by 2024–25.
- According to the State of India’s Digital Economy Report 2024, released by ICRIER, India now ranks third in the world for digitalisation of the economy.
- By 2030, India’s digital economy is projected to contribute nearly one-fifth of the country’s overall economy, outpacing the growth of traditional sectors.
Source: IE
Previous article
Functional Foods