Syllabus: GS2/Health/GS3/Environment
Context
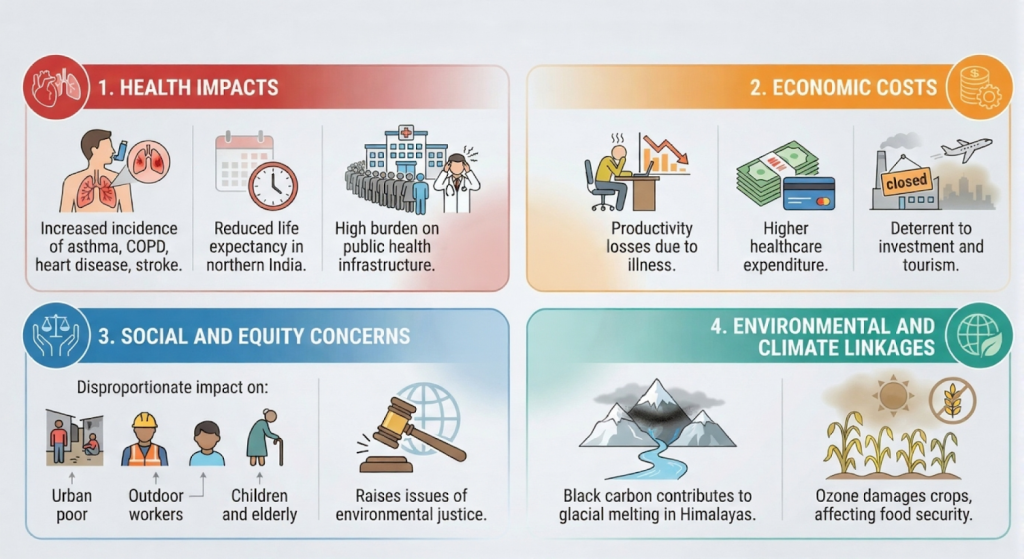
- Delhi’s toxic air has become a full-blown public health emergency, with local emissions and trapped winter pollutants driving the worst AQI levels in years.
Delhi’s AQI
- The air quality index (AQI) has stayed above 450 for days, with grey-brown skies showing no sign of clearing.
- International indexes suggest the AQI may be closer to 700.
- An air quality index (AQI) reading between 51 and 100 is considered a ‘satisfactory’ category, 201 and 300 ‘poor’, 301 and 400 ‘very poor’, and 401 and 450 ‘severe’.
- Invisible pollutants have resulted in hazardous air quality across the northern regions of the Indian subcontinent, with no catch-all solution.
- A third comes from smoke and gases mixing in the air from vehicles and factories,a fifth from crop stubble and wood burning, and vehicles themselves add another 17%.
- Coal, household fuels, and dust make up the rest.
- Delhi’s wintertime spikes in AQI levels are caused by a myriad of factors, worsened by unfavourable meteorological conditions that trap pollutants close to the surface.
What’s Really Causing Delhi’s Air Quality Crisis?
- Delhi’s Topography: Delhi is surrounded by natural barriers on two sides, in the north, the Himalayas and on the southwest side, the Aravalli Hills block wind movement.
- As a result, polluted air cannot disperse and has nowhere to escape.
- Temperature Inversion (Urban Heat Island Effect): During winter, the air near the ground becomes cooler than the air above it.
- This inversion layer traps pollutants (such as particulate matter and gases) close to the surface, preventing their vertical dispersion into the upper atmosphere.
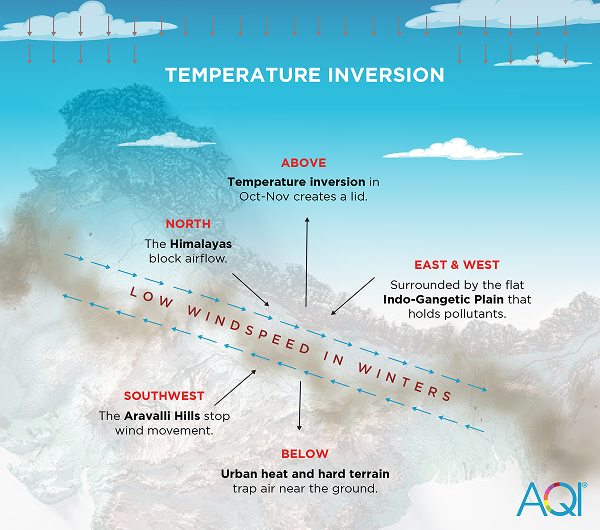
- Low Wind Speeds: Winds are generally weaker in winter, which reduces horizontal dispersion of pollutants, allowing them to accumulate in the lower atmosphere.
- Crop Residue Burning: Each year, post-harvest stubble burning in neighbouring states like Punjab, Haryana, and western Uttar Pradesh releases large amounts of smoke and particulate matter.
- However, newly published data from the Central Pollution Control Board (CPCB) demonstrates that the proportional contribution of stubble burning to Delhi’s PM2.5 in 2025 is negligible.
- Dust and Urban Pollution Entrapment: Local emissions from vehicles and combustion sources are the most significant contributors.
- Urban dust and vehicular emissions linger longer in the atmosphere due to low boundary layer height in winter, compounding the pollution problem.
Gaps in India’s Current Policies to Curb Air Pollution
- National Clean Air Programme (NCAP): Despite being the flagship program, only 31% of the 131 NCAP cities currently meet air quality standards, with just 14 of 43 NCAP cities achieving even 10% PM2.5 reduction between 2019-2021.
- Power Plants: Thermal power plants, which contribute approximately 60% of industrial particulate matter emissions, remain essentially uncontrolled through successive deadline extensions.
- The initial 2017 deadline for Flue Gas Desulfurization (FGD) installation was extended to 2022, then again to 2025, and most recently to December 2027—marking the third delay since 2015.
- Vehicle Emission Testing System: A 2025 Comptroller and Auditor General (CAG) audit found that over 1.08 lakh vehicles received Pollution Under Control (PUC) certificates despite exceeding permissible limits for carbon monoxide and hydrocarbons.
- The audit found zero government inspections of pollution-testing centers and no third-party audits ensuring compliance.
- Budget Utilisation: Between FY 2019-24, approx. 67% of NCAP funds were spent on road dust mitigation, while vehicular pollution control received only 14% and industrial pollution control received 0.61%.
- This allocation pattern directly contradicts sectoral contribution data identifying vehicular and industrial emissions as primary pollution sources.
- Institutional Fragmentation: Multiple agencies operate with overlapping mandates but diffuse responsibility.
- This fragmentation ensures that no single authority bears full responsibility for failure.
China’ Model to Curb Air Pollution
- Air Pollution: China’s air pollution crisis peaked around 2010–2013, especially in northern cities like Beijing, where PM2.5 often exceeded 500 µg/m³ (hazardous).
- Targeted Plans: China launched the Air Pollution Prevention and Control Action Plan (2013–17) and Blue Sky Protection Campaign (2018–20) with clear, time-bound pollution reduction targets and strict enforcement.
- Rapid Reduction in Coal Use: Shut thousands of small coal boilers, capped coal consumption in urban areas, upgraded power plants to ultra-low emissions, and shifted industries and households to cleaner fuels like gas and electricity.
- Industrial Restructuring & Compliance: Closed or relocated polluting units (steel, cement, aluminium), mandated pollution-control equipment, and implemented real-time emission monitoring directly linked to government servers.
- Transport Reforms & EV Push: Introduced stringent China V/VI emission norms, phased out old vehicles, restricted car ownership in cities, and created the world’s largest electric vehicle ecosystem.
- Massive Expansion of Monitoring & Technology: Set up 1500+ air quality monitoring stations, published real-time AQI data, used satellites and AI to locate pollution hotspots, and enabled strong public and administrative accountability.
- Strong Enforcement & Local Government Accountability: Central inspection teams conducted surprise audits, imposed heavy fines, shut illegal units, and publicly named local governments that failed to meet targets—ensuring compliance through pressure and penalties.
| Great Smog of London – The 1952 Great Smog of London lasted barely five days, yet it shocked policymakers into action. At least 4,000 lives were lost. – Primary Causes: Extensive coal burning (domestic heating and power plants), industrial emissions, and stagnant weather conditions. – Pollutants: High concentrations of smoke (soot) and sulphur dioxide (SO₂), forming dense smog. – It forced Parliament to pass the Clean Air Acts, changing how cities were heated by restricting coal-burning and switching to natural gas, electricity, and smokeless fuel. |
Way Ahead
- National Targets: India aims to reduce PM2.5 levels by 40% by 2026, but more detailed local data is needed for effective action, such as vehicle types, fuel used, and traffic patterns.
- The current data gap affects fund utilization and makes air pollution a secondary concern for municipalities.
- High-Impact Industrial Enforcement: Strictly enforce coal power plant emission standards without deadline extensions, integrate biomass co-firing, and impose automatic penalties.
- Avoiding the “Western Trap”: Over-reliance on high-tech solutions and urban-centric tools could divert attention from basic pollution sources like biomass burning, old industrial processes, and polluting vehicles.
- Focus on Implementation: Separate funding streams for research and immediate interventions are needed.
- Global Guidance: Countries like China, Brazil, California, and London offer lessons on contextual, tailored approaches.
- India should innovate based on its own unique needs, focusing on federalism and informal economies.
- Economically Viable Stubble Management: Replace enforcement-only approaches with farmer-centric solutions—crop diversification, free machinery, biomass value chains, and income support during transition.
- Health-Based Standards and Monitoring: Progressively tighten National Ambient Air Quality Standards (NAAQS) toward WHO norms, integrate air quality data with epidemiological tracking, and ensure transparent, real-time public dashboards.
| Daily Mains Practice Question [Q] Despite multiple policy interventions, air quality outcomes in Delhi-NCR remain poor. Analyse the key gaps in India’s current air pollution control policies. |
Source: BL
Previous article
The Road to Universal Health Coverage in India
Next article
Why Does India’s GDP Measurement Requires a Reset?