Syllabus: GS3/ Economy
Context
- Economists from the RBI have updated the poverty line established by the Rangarajan Committee in 2014, for 20 major states of India using the latest Household Consumption Expenditure Survey (HCES) 2022-23.
What is a Poverty Line?
- A poverty line is a threshold level of income or consumption used to determine whether an individual or household is poor.
- Anyone living below this threshold is considered unable to afford basic necessities such as food, shelter, clothing, education, and healthcare.
- It helps the government;
- to gauge the extent of poverty and shape welfare policies for the poor.
- to understand whether a set of policies has actually worked over time to reduce poverty and improve wellbeing.
Rangarajan Committee (2014) for Poverty Estimation
- It was constituted in 2012 and submitted its report in 2014.
- The Committee recommended separate consumption baskets for rural and urban areas.
- The Rangarajan Committee set the rural poverty line at ₹972 per month (₹32 per day).
- The urban poverty line was set at ₹1,407 per month (₹47 per day).
- These estimates pegged 29.5 percent of the Indian population as poor in 2011-12.
- The government did not take a call on the report of the Rangarajan Committee, therefore, poverty is measured using the Tendulkar poverty line.
RBI’s Updated Poverty Estimates
- The RBI researchers updated the 2012 poverty lines by constructing a new price index based on the Rangarajan Poverty Line Basket (PLB), instead of using the Consumer Price Index (CPI), whose consumption weights differ from PLB.
- Food expenditure weights:
- Rural PLB: 57% (54% in CPI-Rural)
- Urban PLB: 47% (36% in CPI-Urban)
| Tendulkar Committee (2009) – It was constituted in 2005 and submitted its report in 2009. – The Committee recommended a shift away from calorie consumption based poverty estimation and incorporation of private expenditure on health and education while estimating poverty. – Instead of monthly household consumption, consumption expenditure was broken up into per person per day consumption, resulting in the figure of Rs 32 and Rs 26 a day for urban and rural areas. – The national poverty line for 2011-12 was estimated at Rs. 816 per capita per month for rural areas and Rs. 1,000 per capita per month for urban areas. |
Key findings of latest update
- Odisha and Bihar have made the biggest improvement over the last decade.
- Odisha: Rural poverty fell from 47.8% to 8.6%.
- Bihar: Urban poverty fell from 50.8% to 9.1%.
- Lowest Rural Poverty (2022-23): Himachal Pradesh (0.4%).
- Lowest Urban Poverty (2022-23): Tamil Nadu (1.9%).
- Highest Poverty: Chhattisgarh (Rural 25.1%, Urban 13.3%).
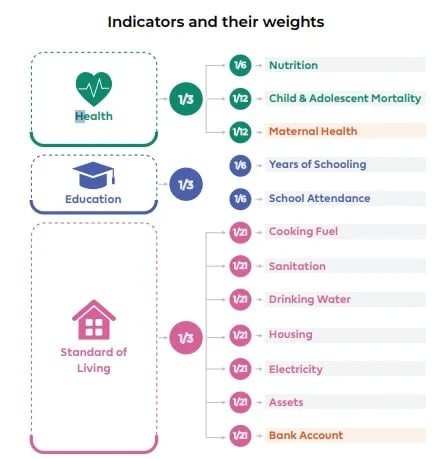
Shift Toward Multidimensional Poverty
- The Government of India now prioritises Multidimensional Poverty Index (MPI) over income-based poverty lines.
- NITI Aayog, has been responsible for constructing an index for monitoring the performance of States and Union Territories in addressing multidimensional poverty.
- According to NITI Aayog, 24.82 crore people escaped from multidimensional poverty between 2013–14 and 2022–23, lowering the poverty rate from 29.17% to 11.28%.
Concluding remarks
- India has witnessed a sharp decline in poverty, with states like Odisha and Bihar showing remarkable improvement.
- However, debates continue over the appropriate methodology and definition of poverty, whether it should be assessed through monetary thresholds or through multidimensional indices.
- The evolving poverty metrics highlight India’s broader transformation, from measuring “how much people earn” to evaluating “how well people live.”
Source: IE
Previous article
Lead Exposure: Major Public Health and Economic Threat