Syllabus: GS3/Indian Economy
Context
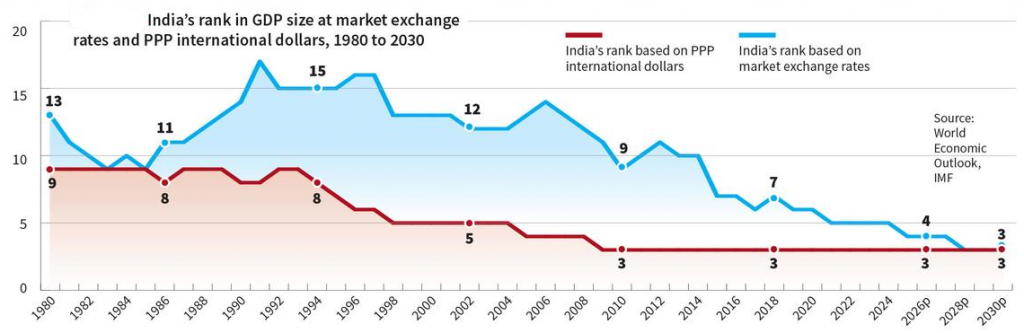
- According to recent data from the IMF, India has surpassed Japan to become the world’s fourth-largest economy by nominal GDP based on Market Exchange Rates (MER), however Purchasing Power Parity (PPP) rankings suggest India has been the third-largest economy since 2009.
Understanding GDP and India’s Economic Rank
- Gross Domestic Product (GDP) represents the total value of all goods and services produced within a nation’s borders over a specific period.
- Governments, economists, and policymakers rely on GDP to assess economic growth, formulate policies, and compare economies globally.
India’s GDP Ranking: MER or PPP Methods
- India’s GDP ranking varies depending on whether it is measured using Market Exchange Rates (MER) or Purchasing Power Parity (PPP).
- Market Exchange Rates (MER): It converts a country’s GDP into US dollars using current exchange rates.
- It reflects the economy’s size in global financial markets but does not account for cost-of-living differences.
- Purchasing Power Parity (PPP): It adjusts GDP based on the relative cost of goods and services in different countries.
- It provides a more accurate measure of economic strength by considering what people can actually buy with their incomes.
- PPP is often considered a better measure of economic well-being because it accounts for differences in living costs.
- Market Exchange Rates (MER): It converts a country’s GDP into US dollars using current exchange rates.
| GDP: Market Exchange Rates (MER) | |
| Pros | Cons |
| Reflects Global Financial Markets;Useful for Foreign Exchange Transactions;Standardized Measurement; | Exchange Rate Fluctuations (Highly volatile over time);Does Not Reflect Domestic Purchasing Power;Volatility in Emerging Markets;Misleading when comparing countries with large cost-of-living disparities. |
| GDP: Purchasing Power Parity (PPP) | |
| Pros | Cons |
| Accounts for Cost-of-Living Differences;Better for Long-Term Comparisons;Reflects Real Economic Productivity; | Less Relevant for International Trade;Data Collection Challenges;Overestimation of Economic Strength (Informal sector and unpaid labor force distort comparisons). |
GDP vs Per Capita GDP
- India’s per capita GDP in 2024: $2,711 (market exchange rates), ranking 144th globally.
- Vietnam, once behind India in 1991, had a per capita GDP of $4,536 in 2024.
- Even in PPP terms, India’s per capita GDP ranks only 127th among 196 countries.
Key Drivers of Growth
- Demographic Advantage: India boasts a young and growing workforce, which contributes to its expanding economy.
- Technological Innovation: The country has made significant strides in digital transformation, boosting productivity and efficiency.
- Infrastructure Development: Investments in roads, railways, and urban expansion have strengthened economic foundations.
- Global Trade and Manufacturing: India’s push to become a manufacturing hub has attracted foreign investments and enhanced exports.
Challenges Ahead
- Income Inequality: Economic progress has not been evenly distributed, with disparities in wealth and access to resources.
- Concerns Related to Employment, Health, Education: While GDP growth is strong, job creation has lagged, raising concerns about sustainable development, income distribution, health, education, or living conditions.
- Policy Reforms: Continued structural reforms are necessary to maintain momentum and address economic vulnerabilities.
Way Forward: Beyond GDP Measures
- There is a need to move beyond GDP and embrace multi-dimensional indicators, such as: Health outcomes, Educational attainment, Access to basic services, Income equality, and Quality of employment to accurately assess India’s development status.
Conclusion
- Both MER and PPP offer valuable insights, but PPP is often considered a better measure of economic well-being, as it accounts for cost-of-living differences and reflects real purchasing power.
- However, MER remains crucial for assessing India’s position in global trade and investment.
| Daily Mains Practice Question [Q] India ranks differently based on Market Exchange Rates (MER) and Purchasing Power Parity (PPP). In your opinion, which method provides a more accurate representation of India’s economic strength, and why? |
Previous article
India’s Maritime Ambition: Time to Build Our Own Marine Engines
Next article
Modern, Asymmetric & Hybrid Warfare