Down To Earth (16-31 July, 2025)
The following topics are covered in the Down To Earth (16-31 July, 2025):
How India Moves: A Nation Stuck In Gridlock
Context
- India’s urban mobility crisis is no longer just a matter of inconvenience—it’s a full-blown public health, productivity, and environmental emergency.
Scope of the Study
- Between May and June 2025, study over 40 cities, categorizing them into:
- Mega/Metro Cities (population over 4 million);
- Million-Plus Cities (1–4 million);
- Sub-Million Cities (under 1 million)
Core Finding: Urban India Is Gridlocked
- Indian cities suffer from chronic congestion—not just metros but also tier-2 and tier-3 cities.
- Congestion is worsening travel times, air pollution, and quality of life, with a significant mental health toll.
- The findings were drawn from city mobility plans, independent research, and on-ground reportage— often relying on outdated or incomplete data due to the lack of official systems tracking urban mobility trends.
Non-Motorised Transport (NMT): Walking and Cycling
- Nearly half of urban commuters still walk or cycle to work.
- Cities like Mumbai (47%), Kolkata (48%), and Delhi (42%) show high reliance on non-motorised transport (NMT).
- Smaller cities like Varanasi (54.5%), Singrauli (64%), and Visakhapatnam (55%) also depend heavily on NMT.
- NMT has grown: Mega cities: ↑5%; Sub-million cities: ↑3.2%
- However, most cities lack safe infrastructure for pedestrians and cyclists, with exceptions like Mysuru and Kochi making modest progress.
Private Vehicles Dominate the Roads
- In 2024–25, India registered 25.5 million vehicles, with 88% for personal use.
- Two-wheelers dominate in metro cities like Bengaluru (27.1%), Chennai (29.6%), and Hyderabad (29%).
- In million-plus cities, two-wheeler usage exceeds 30%, peaking at 43% in Dehradun.
- Surprisingly, car usage is rising in sub-million cities, with Gangtok (54%) leading the pack—often due to poor public transport connectivity.
Transport Mode Trends (2023 Data)
- Private vehicles dominate urban travel: Over 88% of new vehicle registrations in 2024–25 were private.
- Two-wheelers are most used in tier-2 cities (30–43% modal share in places like Kochi, Dehradun, Thiruvananthapuram).
- Car usage is especially high in small cities like Gangtok (54%) and Shillong (25%).
Public Transport Crisis
- Bus usage has dropped:
- Mega cities: ↓5.69%
- Indore, Jaipur, and Bhopal: fleets shrinking or dismantled.
- Metro rail investment has led to minimal modal shift: only +0.81%
- Exception: Srinagar, where 64% use buses due to vehicle restraint policies.
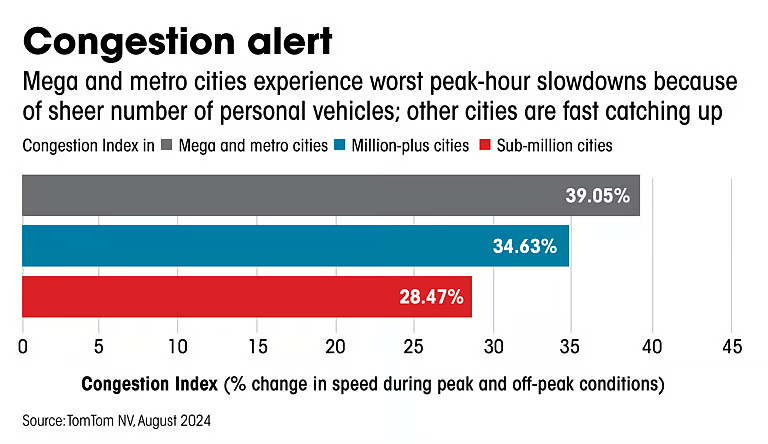
Congestion Index (TomTom 2024)
- Average congestion index: Mega cities: 39.05%; Million-plus cities: 34.63%; Sub-million cities: 28.47%;
- Bengaluru, Chennai, and Kolkata rank among the slowest global cities for travel.
City Profiles and Trends
- Delhi: Leads in car additions (513 cars/day in 2024– 25).
- Despite massive metro and bus investments, pollution and congestion remain severe.
- Key pedestrianization experiments (Ajmal Khan Rd, Chandni Chowk) failed due to poor maintenance.
- Jaipur: Public bus fleet shrunk drastically from 400 to 110
- Focus has shifted to metro expansion over costeffective bus systems.
- Lucknow: Flyovers and uncontrolled e-rickshaw growth worsen congestion.
- Working-class commuters spend up to 20% of daily income on transport.
- Chandigarh: Highest per capita vehicle density.
- Originally well-planned, now struggling with rapid satellite town expansion (Mohali, Panchkula).
- Indore: Dismantled its model BRTS; metro unaffordable for the poor.
- The court mocked congestion concerns, calling them ‘pointless.’
- Singrauli: Dominated by coal trucks, unsafe for cyclists and pedestrians.
- Public bus service is almost non-existent.
Key Insights
- Congestion Crisis: Peak-hour travel times in cities are nearly double those during off-peak hours.
- Three Indian cities—Kolkata, Bengaluru, Pune— rank among the top five globally for slowest urban travel.
- In cities like Delhi, average speeds during peak hours fall below 25 km/hr.
- Public Transport Decline: Bus ridership is shrinking across mega and metro cities, with some systems dismantled (e.g. Indore and Bhopal's BRTS).
- Despite huge investments, metro systems have yielded only marginal improvements in modal share.
- Public transport accounts for less than 25% of total trips in most cities.
- Private Vehicle Surge: Personal vehicles make up 88% of all new vehicle registrations.
- Car dependence is rising sharply, especially in smaller towns bypassing the two-wheeler phase (e.g. Gangtok 54% trips by car).
- In cities like Dehradun and Thiruvananthapuram, two-wheelers dominate up to 43% of trips.
- Non-Motorised Transport (NMT) Still Vital: Walking and cycling constitute 42–48% of trips in Delhi, Mumbai, Kolkata.
- Despite growing use, cities lack infrastructure— footpaths and cycle lanes are scarce or encroached.
- Intermediate Public Transport (IPT) Fills the Void: In the absence of formal public systems, shared autos, e-rickshaws, and minibuses dominate in cities like Patna and Ranchi.
- Growth: Million-plus cities: ↑5.98%; Sub-million cities: ↑3.4%
- In cities like Patna and Ranchi, IPT accounts for a higher share than formal public transit.
Core Issues Identified
- Data Gaps: Most cities lack updated or consistent mobility data.
- Many cities lack updated data on modal share, travel demand, and congestion impacts.
- For example, data for Kolkata is 25 years old, while cities like Ahmedabad and Tiruchirappalli have no reliable modal data at all.
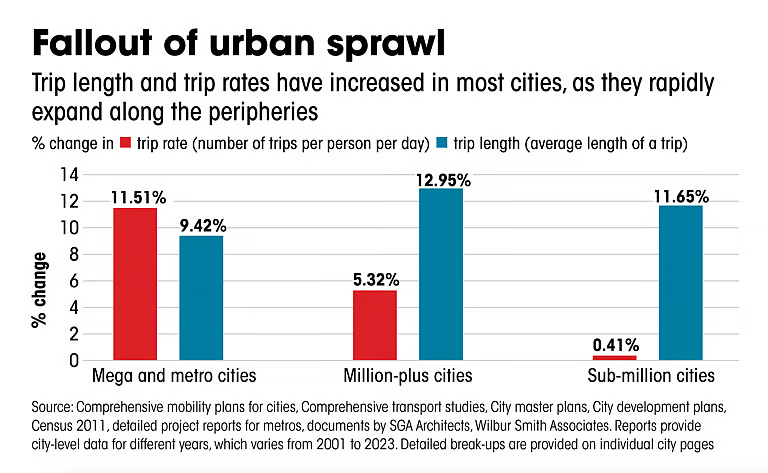
- Urban Sprawl & Longer Commutes: Commuters now travel farther: Mega cities: ↑11.5% trip rates, ↑9.4% trip lengths.
- Example: Delhi trip length doubled from 6 km to nearly 11 km.
- Peripheral housing has expanded, pushing people towards private modes.
- Weak Policy Coordination: Fragmented governance undermines integrated planning.
- Infrastructure Bias: Cities prioritize roads and flyovers over people-centric mobility.
- Traffic Congestion & Lost Productivity: Peak-hour travel times can double, costing top metros over $22 billion annually in lost productivity and fuel waste.
- Air Pollution & Health Risks: Vehicular emissions contribute significantly to PM2.5 and NOx levels. In cities like Surat, transport accounts for 85% of NOx emissions.
- Road Safety Crisis: India recorded 1.68 lakh road fatalities in 2022. Vulnerable users—pedestrians, cyclists, and children—are disproportionately affected.
- Equity & Accessibility: Low-income groups spend up to 40% of their income on transport.
- Women and marginalized communities face barriers to safe and affordable mobility.
Environmental and Public Health Toll
- Vehicles contribute:
- ~40% of particulate matter (PM) in Delhi;
- ~81% of NOx emissions (source: TERI, ARAI, IITM)
- Traffic congestion increases roadside exposure to toxic air—especially harmful in cities with poor bus networks.
Government Policies & Frameworks: For Urban Mobility in India
- National Urban Transport Policy (NUTP): Focuses on people-centric mobility, integration of land use and transport planning, and promotion of NMT.
- Transforming India’s Mobility – NITI Aayog’s 3C Framework: Advocates for Clean, Convenient, and Congestion-free mobility through four pillars: Connect Bharat, Optimize Travel Footprint, Promote Seamless Public Transport, and Adopt Green Technologies.
- Smart Cities Mission & TOD Policy: Encourages compact, mixed-use development integrated with public transport.
Public Transport Expansion
- Metro Rail Projects: India is investing ₹3 trillion in metro infrastructure between 2022–2027.
- Delhi leads with a 395 km network, though ridership remains below projections.
- Electric Bus Initiatives: Schemes like PM e-Bus Sewa aim to deploy 14,000 e-buses nationwide.
- Shared Mobility & ITS: Cities like Surat and Bengaluru are adopting Intelligent Transport Systems and shared mobility platforms.
Active Mobility & Safety
- Karnataka Active Mobility Bill: Aims to protect pedestrian and cyclist rights, mandating infrastructure development.
- Safe System Approach: Emphasizes forgiving road design, reduced speed limits, and inclusive planning.
Recommendations & Interventions
- Rebuild bus systems as core public transport.
- Enhance last-mile connectivity and feeder services.
- Expand pedestrian/cycling infrastructure— especially for short (<5 km) commutes.
- Restrict car ownership: Parking proof mandates, congestion charges.
- Promote zero-emission vehicles and create lowemission zones.
- Financing tools: Land value capture, climate funds, and user-pays models.
Conclusion: A Call for Radical Rethinking
- India’s urban mobility is stuck—literally and figuratively. The report urges policymakers to:
- Invest in safe, inclusive infrastructure for walking and cycling.
- Improve public transport reach and affordability.
- Collect and update mobility data to inform smarter planning.
- Shift focus from car-centric development to people-centric mobility.
Rethinking Urban Mobility: Designing Cities for People
Context
- As Indian cities expand, mobility challenges grow more complex. Yet, despite increasing travel distances, a significant number of daily trips still fall within short ranges — particularly under 5 km, creating a crucial opportunity for cities to foster walkable, cyclable, and transit-friendly environments.
Short Trip Distances
- Data from the Census 2011 reveals that a majority of urban trips in several major cities are within 5 km:
- Kolkata: 56%
- Delhi: 48%
- Mumbai: 44.4%
- Bengaluru and Chennai: 47%
- These figures highlight the immense potential for promoting non-motorised transport (NMT) and enhancing last-mile connectivity through sustainable means.
Beyond Infrastructure: Need for Restraint Measures
- While scaling up public transport infrastructure remains essential, it must be complemented by effective demand management strategies:
- Parking management and variable pricing;
- Congestion and road pricing mechanisms;
- Policy reforms to internalize the full cost of private vehicle ownership;
- These steps are critical to addressing the growing threat of urban congestion.
Clean Mobility Pathways and Low-Emission Zones
- Cities must also pursue long-term strategies to decarbonise transport:
- Accelerate adoption of zero-emission and electric vehicles (EVs);
- Establish low-emission zones (LEZs) with:
- Expanded pedestrian and cycling networks;
- Intensified public transport services
- This multi-pronged approach supports both climate goals and livable cities.
Sustainable Financing: New Models for Urban Transport
- A transformative shift in urban mobility requires reliable and diversified funding. Beyond increasing budgetary allocations, cities can explore:
- Land value capture mechanisms;
- Polluter pays principles;
- Accessing climate finance funds;
- Importantly, financing strategies must be adapted to suit the unique needs of different city classes.
Data-Driven Mobility Planning
- A persistent challenge in Indian urban transport is the lack of up-to-date and granular data. This hampers effective planning and monitoring. Every intervention — from NMT infrastructure to EV incentives — need to include:
- Clear targets;
- Institutional mandates;
- Measurable indicators
- All aligned with service level benchmarks for consistent accountability.
Conclusion: Cities for People, Not Cars
- As emphasized in the National Urban Transport Policy, urban spaces must prioritize people over vehicles.
- Building compact, inclusive, and sustainable transport systems is not just a necessity — it is a transformative opportunity for the future of India’s cities.
Reimagining Agglomeration: Future of Urban Productivity in India
Context
- Cities in India like Bengaluru, Mumbai, and Delhi grapple with traffic gridlocks, housing shortages, and environmental stress.
About
- Agglomeration — the concentration of firms, workers, and ideas — has long been a hallmark of urban economic theory.
- From Alfred Marshall to Edward Glaeser, economists have praised dense urban centres for unlocking productivity through shared infrastructure, labour pools, and innovation.
Promise and the Pitfalls of Urban Clustering
- Urban India contributes more than 60% to the national GDP, a share projected to rise to 70% by 2030.
- Cities continue to draw investment and labour, backed by government promises of smart infrastructure and green growth. Yet, the realities on the ground tell a different story:
- Bengaluru’s daily congestion stretches over 190 km, costing ₹1,170 crore in lost productivity.
- Mumbai faces an acute housing crunch and inflated real estate costs.
- Delhi is suffocating under persistent air pollution and administrative overload.
- Pune, despite high liveability scores, has lost one-third of its green cover in a decade.
- Bhubaneswar and Nagpur are seeing productivity losses of 10–13% among informal workers due to extreme heat.
- These trends signal that simply clustering people isn’t enough — quality of interaction is key.
When Density Stops Working
- The core of effective agglomeration lies in enabling people to collaborate, move, and innovate. But when:
- Commutes exceed two hours;
- Housing consumes half of household income;
- Heat and pollution threaten health and wages,…the gains from urban concentration begin to erode.
- India’s current model is increasingly one of partial agglomeration: dense, but dysfunctional.
A Systemic Shortfall: Municipal Performance and Planning
- A 2024 municipal performance study uncovered troubling gaps:
- Only 94 out of 152 municipalities had accessible planning data.
- Just 59 had updated GIS-based development plans.
- Only 37 had active mobility plans.
- A mere 16 had full town planning scheme coverage.
- While 113 municipalities reported hiring qualified planners, governance remains fragmented and inconsistent.
- This lack of coherent planning undermines the productivity gains that urban density is supposed to deliver.
Productivity Gap: A Call for Strategic Urbanism
- The Asian Development Bank highlights a key disparity: Wage elasticity with respect to urban density in India is just 1–2%, compared to 4–6% in more advanced urban economies. This suggests not just infrastructure deficits, but a deeper lack of coordinated urban strategy.
What’s Needed?
- Robust data systems for real-time planning and service delivery.
- Flexible, scenario-based planning to adapt to climate, demographic, and economic shifts.
- Governance reform to eliminate jurisdictional overlaps and integrate housing, transport, and environment.
- Spatial planning that links people with jobs, services, and innovation networks.
Global Benchmarks: Lessons from Asia
- India can draw lessons from peers who’ve translated density into success:
- Singapore: A model of integrated land use and transport planning. Its MRT system serves over 3 million daily riders, supported by congestion pricing and compact design.
- Ho Chi Minh City: Higher labour productivity than Hanoi, driven by strategic infrastructure and industrial concentration.
- These examples underscore that agglomeration works — but only when backed by smart design.
Deglomeration or Reagglomeration?
- India’s urban landscape today shows signs of deglomeration, not due to overachievement, but under-preparation.
- The expected outcomes — innovation, productivity, opportunity — have been realized unevenly, hamstrung by poor infrastructure and fragmented governance.
Path Forward: Designing Density with Purpose
- Reagglomeration demands a deliberate, secondgeneration approach to urban development that prioritizes:
- Quality over quantity in urban expansion.
- Resilience to climate and environmental risks.
- Equity in access to jobs, housing, and services.
- The old agglomeration curve can no longer be relied upon to lift cities automatically. It needs now be redrawn — thoughtfully, inclusively, and sustainably.
Subjective Questions for Practise
Q1. How does the concept of 'designing cities for people' challenge traditional approaches to urban mobility, and what role do empathy and inclusivity play in shaping transportation systems that genuinely serve diverse urban populations?
Q2. How might cultural, technological, and spatial dynamics redefine what makes a city economically vibrant?
QUICK LINKS