Down To Earth (December 16-31 2023)
DROUGHT FORECASTING IN INDIA
Context:
- There is a need for the long-term drought forecasting and monitoring system to help agricultural production, water resources and irrigation systems in India.
About:
- Drought forecasting systems use models fed by climatic and atmospheric data (historical/seasonal weather patterns, real-time meteorological monitoring, and weather forecasts) to predict the probability of a drought occurring in a region or area of interest in the near future.
- These are an important part of early warning systems, as they provide lead-time to planners for threat responses, which helps minimise drought impact risk.
- Hydrological indicators (e.g. soil moisture index), real-time meteorological observations, and meteorological forecasts, coupled with historical weather patterns, provide input data to models used to forecast the hydrological conditions in a specific area, and determine whether there is an increasing risk of drought.
|
Drought:
Types of droughts: Meteorological Drought:
Hydrological Drought:
Agricultural Drought:
Socio-economic drought:
Impacts:
|
Significances:
- Environmental: Provides timely measures to minimise impacts such as land degradation and desertification.
- Socioeconomic: Anticipates and mitigates the drought effects by providing lead-time for response measures, especially to ensure food and water security (water conservation, soil conservation techniques, etc.).
- Reduces famine risks and ensures economic activity continues to the extent possible during droughts.
Challenges in forecasting:
- Long range drought forecasts have a high degree of uncertainty.
- The effects of climate change result in increasingly unpredictable weather patterns, making forecasts less precise.
- Models may produce a wide range of probabilities, with a healthy level of uncertainty.
- Some systems, such as model simulations, require a high level of technical expertise to install and operate.
Way Forward:
- Any model needs to be validated at the local, regional, state and national levels. Many reputed scientific institutions in India have developed good simulation and other crop-weather models.
- For long-term drought forecasting, we need to monitor and strengthen input parameters like remote sensing satellite data and ocean-atmospheric interaction.
TRADITIONAL SEED SAVING PRACTICES
Context:
- Saving an agricultural seed translates to protection of biodiversity, and rescues a generation from hunger.
About:
- 93% of seed varieties have been lost to what’s popular over the last century due to industrial agriculture alongside monopolies from agrochemical companies and multinational corporations who now own the rights to a large share of the world’s seeds.
- According to the Food and Agricultural Organization (FAO), 75% of the current global food supply can only be traced back to 12 plants and five animal species.
- India’s Green Revolution helped reduce hunger, however, the production of other indigenous rice varieties and pest and disease resistant millets declined due to the promotion of high-yielding varieties of rice and wheat.
Significance:
- Preservation of seeds is an ancient practice, acting as a safeguard in emergency situations such as drought and floods.
- Although there are modern methods to collect and store seeds, developing the infrastructure needed can be expensive, which makes farmers turn back to the traditional systems followed by their ancestors.
- Seed saving is beneficial for agricultural biodiversity, which is essential to a healthy ecosystem, and sustainable food supply.
- Seed sovereignty is the right of a farmer to save, use, exchange, and sell his or her own seeds and addresses the ownership of seeds while a large majority of them are property of corporations, which threatens many farmers and Indigenous communities’ ability to save local seeds that have existed in their communities for centuries.
Global Efforts:
- The United Nations, in 2018, codified the right to seed in a Declaration on the Rights of Peasants and Other People Working in Rural Areas (UNDROP). The legal document grants small landowners and agricultural labourers protection over conservation activities in order for rural people to 'maintain, control, protect, and develop their own seeds and traditional knowledge'.
- The Organic Seed Alliance of the USA is helping to push policy changes in 2023 with an accessible roadmap for policymakers to help resist privatisation of seeds and increase investments in public plant breeding as a climate change solution.
- Seed Banks store seeds to protect their biodiversity for the future. The largest seed bank is located in the Tundra near the Arctic Circle in Svalbard, Norway.
- It contains 13,000 years of agricultural history, which has been dubbed the ‘doomsday vault’ in place to abate localised threats.
- Action for Solidarity, Equality, Environment, and Diversity Europe (ASEED) Europe: It campaigns for the preservation of cultural and biological diversity, and supports the sovereignty of individuals and communities, while also exploring alternatives to the industrial food system.
URBAN FLOOD
Context:
- The Prime Minister of India approved the country's first urban flood mitigation project under the National Disaster Mitigation Fund.
About:
- The project aims to focus on flood management activities in the Chennai basin, in the wake of destruction due to Cyclone Michaung that caused heavy rainfall in Tamil Nadu, Andhra Pradesh and Odisha recently.
Urban Floods:
- Increased incidence of high-intensity rainfall in short duration is mainly responsible for urban floods.
- It is further compounded by unplanned growth, encroachment of natural water bodies, poor drainage system, etc.
- Urban flooding is significantly different from rural flooding as urbanisation leads to developed catchments, which increases the flood peaks from 1.8 to 8 times and flood volumes by up to 6 times.
Causes of Urban Floods:
- Weather systems: A special feature in India is that we have heavy rainfall during monsoons.
- There are other weather systems also that bring in a lot of rain.
- Storm surges can also affect coastal cities/ towns.
- Dam Water: Sudden release or failure to release water from dams can also have a severe impact.
- Urban Heat Island: The urban heat island effect has increased rainfall over urban areas.
- Climate Change & Sea Level Rise: Global climate change is resulting in changed weather patterns and increased episodes of high-intensity rainfall events occurring in shorter periods.
- Cities/towns located on the coast, on river banks, upstream/ downstream of dams, inland cities and in hilly areas can all be affected.
Urban Challenges & Floods in India:
- Encroachment & Habitations: Encroachment is a major problem in many cities and towns.
- Natural streams and watercourses have formed over thousands of years due to the forces of flowing water in the respective watersheds.
- Loss of Drains: Ideally, the natural drains should have been widened (similar to road widening for increased traffic) to accommodate the higher flows of stormwater.
- Improper disposal systems: Improper disposal of solid waste, including domestic, commercial and industrial waste and dumping of construction debris into the drains also contribute significantly to reducing their capacities.
- Insufficient policy attention: Even though urban flooding has been experienced over decades in India, sufficient attention was not given to planning specific efforts to deal with it.
Measures to curtail urban flooding:
- Increased incidence of high intensity rainfall in short duration is mainly responsible for urban floods which is further compounded by unplanned growth, encroachment of natural water bodies, poor drainage system, etc.
- Management of urban flooding falls under purview of the State Governments and the Urban Local Bodies / Urban Development Authorities who are responsible for maintaining the drainage and sewerage system.
- Master Plan for Artificial Recharge to Groundwater - 2020: It has been prepared by the Central Ground Water Board (CGWB) in collaboration with States/UTs envisaging construction of about 1.42 crore rain water harvesting and artificial recharge structures in the country to harness 185 Billion Cubic Meter (BCM) of water.
- Jal Shakti Abhiyan (JSA): Its emphasis is being given for rainwater harvesting/groundwater recharge in water stressed blocks across India with the primary aim to effectively harvest the monsoon rainfall through creation of artificial recharge structures, watershed management, recharge and reuse structures, intensive afforestation and awareness generation etc.
- JSA for the year 2023 has been launched with the theme ‘Source Sustainability for Drinking Water’.
- The Amrit Sarovar Mission: It has been launched with an aim of developing and rejuvenating 75 water bodies in each district of the country as a part of celebration of Azadi ka Amrit Mahotsav for rainwater harvesting/recharge.
- Atal Bhujal Yojana: The focus is on demand side management of ground water and accordingly water saving interventions such as use of micro irrigation (drip/sprinkler system), shifting of cropping pattern from high water intensive crops to low water intensive crops, mulching etc. are being encouraged and incentivised.
- The Atal Mission for Rejuvenation and Urban Transformation (AMRUT) 2.0 Scheme: The provisions have been made for harvesting the rainwater through storm water drains into the water body (which is not receiving sewage/effluent) & creation/ strengthening of storm water drains around the water body.
- Model Building Bye Laws (MBBL) 2016 for the States/UTs: It was formulated by the Ministry of Housing & Urban Affairs (MoHUA).
- All buildings having a plot size of 100 sq.m. or more shall mandatorily include the complete proposal of rainwater harvesting. 35 States/UTs have adopted the features of the Bye Laws.
- The National Water Policy (2012): The policy is formulated by this Ministry inter alia advocates that the conservation of rivers, river corridors, water bodies and infrastructure should be undertaken in a scientifically planned manner through community participation.
- Urban Flood Mitigation Project: India’s maiden urban flood mitigation project worth Rs 561 crore under the National Disaster Mitigation Fund (NDMF).
WORLD MALARIA REPORT 2023
Context:
- The World Health Organization (WHO) recently released the World Malaria Report for 2023.
Major Finding of the Report:
- Role of climate change: For the first time, a dedicated chapter focused on the intersection between climate change and malaria.
- Climate change is one of many threats to the global response to malaria.
- Conflict and humanitarian crises, resource constraints and biological challenges such as drug and insecticide resistance also continue to hamper progress.
Global Burden:
- In 2022, the global tally of malaria cases reached 249 million – well above the estimated number of cases before the COVID-19 pandemic, and an increase of five million over 2021.
- The WHO South-East Asia Region had nine malaria endemic countries in 2022, accounting for 5.2 million cases and contributing to 2% of the burden of malaria cases globally.
- Millions of people continue to miss out on the services they need to prevent, detect, and treat the disease.
Specific to India:
- India accounted for about 66% of the 5.2 million malaria cases in 2022 which is the highest for a country in the Southeast Asia region.
- Almost 46% of all cases in the region were due to P. vivax.
- India and Indonesia accounted for about 94% of all malaria deaths in this region in 2022.
- Overall, cases of the vector-borne disease have reduced by at least 55% since 2015.
About Malaria:
Transmission:
Distribution:
|
Initiatives to curb Malaria in India:
- It aims to eliminate malaria by 2027.
- National Framework for Malaria Elimination (2016-2030)
- National Strategic Plan for Malaria Elimination (2017).
- It shifted focus from Malaria control to elimination.
- It provided a roadmap to end malaria in 571 districts out of India’s 678 districts by 2022.
- Malaria Elimination Research Alliance-India (MERA-India) by ICMR
- It is a conglomeration of partners working on malaria control.
EXTREME WEATHER EVENTS
Context:
- The Centre for Science and Environment (CSE), in its report, said that India experienced extreme weather events in the first nine months of 2023.
Extreme Weather Events:
|
Key finding of the report:
- It attempts to build an evidence base on the frequency and expanding geography of extreme weather events in the country.
- It clearly shows, India has witnessed so far in 2023 is the new 'abnormal' in a warming world.
- Lightning and Storms were the most common disasters, affecting the most of the deaths occurring in Bihar.
- However, the most significant devastation came from heavy rains, floods, and landslides, causing over 1,900 casualties.
Region Wise Findings:
- In the North India:
- Madhya Pradesh reported the highest number of extreme weather events at 138. However, the largest number of deaths occurred in Bihar, followed by Himachal Pradesh and Uttar Pradesh.
- Punjab recorded the highest number of animal deaths while Himachal Pradesh reported the most damaged houses due to extreme weather events.
- In the Southern Region:
- Kerala saw the highest count of extreme weather days and deaths.
- Telangana suffered maximum effect on crop area, and witnessed high animal casualties.
- Karnataka faced severe destruction, with over 11,000 houses demolished.
- In the Northwest India:
- Uttar Pradesh had the most extreme weather days.
- Himachal Pradesh, Punjab, Haryana, Uttarakhand, and Rajasthan were significantly affected.
- In the Eastern and Northeastern Regions:
- Assam registered maximum extreme weather events, with over 48,000 hectares of crops devastated.
- Nagaland saw over 1,900 houses destroyed.
The consequences of extreme weather events:
- Death Toll: 2,923 people died, almost two million hectares of crops were ruined, 80,000 homes were destroyed and more than 92,000 animals were killed.
- Wildfires: Heatwaves often trigger virulent wildfires that affect entire communities, destroying homes and damaging health due to smoke inhalation.
- Flooding: The IPCC highlights the high probability that monsoon rainfalls will increase in the medium and long term, especially in South and South-east Asia, causing severe floods.
- Famines: Those sectors that depend on a certain degree of climate stability, such as agriculture, are seeing their production and performance levels undermined, thereby generating food insecurity in certain areas.
- Climate migrations: According to Oxfam, more than 20 million people per year are forced to abandon their homes as a consequence of the effects of climate change, which include extreme weather phenomena.
COP-28 AND MAJOR OUTCOMES
Context:
- The Parties at COP28 have operationalised historic loss and damage funds and agreed to the health impacts of climate change, but have failed to reach a consensus on key issues of climate finance, adaptation goal and global stocktake.
The Conference of the Parties (COP-28) of the UNFCCC:
|
Health recognised as climate imperative:
- As many as 123 countries signed a new declaration on climate and health, acknowledging the link between climate change and public health.
- Signatories have committed to incorporate health targets in their national climate plans and improve international collaboration to address the health risks of climate change and monitor prog-ress in all global forums including future cops and health ministerials.
- Collectively, a wide range of partners and stakeholders have committed to dedicate $1 billion to arrest the climate-health crisis.
Cooling and Decarbonisation Initiatives:
- Along with the UN Environment Programme and Cool Coalition, CoP28 launched the Global Cooling Pledge to improve energy efficiency and climate friendly approaches, while increasing access to sustainable cooling for the most vulnerable.
- A Climate Club was launched to build cooperation between countries in decarbonising the sector.
- The Industrial Transition Accelerator was launched with the aim to catalyse decarbonisation across heavy-emitting sectors, including energy, industry and transportation.
- The Green Public Procurement Pledge was rolled out to enhance demand creation of green products of high-emitting industries like green steel, green cement and green aluminium.
Loss and Damage:
- It represents the irreversible consequences of climate change: impacts that can’t be avoided or mitigated through adaptation efforts.
- It encompasses the real losses that extend beyond monetary value and cut to the core of human rights and well-being.
- It includes economic losses, human casualties, and the degradation of ecosystems and cultural heritage.
Loss and Damage Fund:
- At COP28, Dubai, the $792 million has been pledged.
- The World Bank will oversee the fund for the first four years, and the money will be sourced from rich nations and some developing countries.
- At the 27th Conference of Parties (COP27) to the United Nations Framework Convention on Climate Change (UNFCCC) held in Egypt in November 2022, a historic agreement was reached to establish a Loss and Damage Fund.
- At the COP 19 to UNFCCC in Warsaw, Poland, in 2013, representatives of member countries formally agreed to establish the L&D fund.
- At COP 25, the Santiago Network for L&D was set up, but countries didn’t commit any funds.
- At COP 26, the Glasgow Dialogue on finance for L&D was established to continue discussions over the next three years on the fund.
- It was designed as a multilateral entity that will disburse money to recover from damage that poor countries have suffered due to climate change-induced weather disasters and other impacts.
However negotiations on the Global Goal on Adaptation (GGA) and Global Stocktake have not been finalised in the COP28.
- GGA is a collective commitment under Article 7.1 of the Paris Agreement aimed at ‘enhancing [the world’s] adaptive capacity, strengthening resilience and reducing vulnerability to climate change’.
- The new draft includes the texts ‘principle of common but differentiated respon-sibilities and respective capabilities’ and ‘adaptation finance’ which the developing countries have been demanding for long.
- The Global Stocktake, a fundamental component under the 2015 Paris Agreement, the first draft text and first assessment was scheduled at cop28, which was rejected by countries.
Climate Finance negotiations underway:
- Parties, informally, have dissected different iterations of a draft text of a new goal on climate finance (New Collective Quantified Goal or NCQG) to be decided at COP 29 in 2024.
- Discussions are underway on two broad themes:
- Procedural details for the modality of NCQG work in the coming year and;
- Details on substantive elements including time frame, transparency, inclusivity and scope.
SUGAR SUBSTITUTES
Context:
- The World Health Organization (WHO) announcement on aspartame being possibly carcinogenic to humans has reignited the debate on health hazards of sugar substitutes.
About Sugar Substitutes:
- These are substances used in place of sweeteners that have sugar (sucrose) or sugar alcohols. They have negligible or zero calories because, unlike sugar, they do not get broken down by the body into products that provide energy or calories.
- These are also called Non-sugar sweeteners (NSS) or Non-nutritive sweeteners (NNS).
Types:
- Artificial: These are prepared in laboratories; for example, aspartame and;
- Natural: These are derived from plants( for example, stevia).
Consumption:
- The global rise in cases of diabetes and obesity has resulted in many opting for sugar substitutes to avoid developing the disease, manage weight or cut calories, which is reflected in an increase in the sale of sugar substitutes.
- A 2023 report by global market consultancy projects a rise of 29.4 % in the sale of sugar substitutes—from $20.52 billion in 2022 to 29.08 billion by 2027.
Health Risk:
- WHO advised against the indiscriminate use of artificial sweeteners as they not only do not help to reduce weight, but also increase the probability of suffering from diabetes and similar sugar metabolism disorders.
- It recommends against the use of NSS to control body weight or reduce the risk of noncommunicable diseases (NCDs), which is based on the findings of a systematic review of the available evidence which suggests that use of NSS does not confer any long-term benefit in reducing body fat in adults or children.
- It observed associations between consumption of beverages with artificial sweeteners and some intermediate markers of cardiovascular diseases (CVD), including a modest increase in the unfavourable total cholesterol to HDL cholesterol ratio, and an increased risk of hypertension.
Regulations:
- The US Food and Drug Administration (USFDA) has approved six artificial sugar substitutes and ‘recognizes’ three natural sweeteners as ‘safe’.
- Five of the six US FDA-approved artificial sweeteners and two of three natural sweeteners are approved by the Food Safety and Standards Authority of India (FSSAI).
- FSSAI is the Central agency under the Union Ministry of Health and Family Welfare responsible for formulation of standards to regulate manufacture, storage, distribution, sale and import of foods.
WORLD INTELLECTUAL PROPERTY INDICATORS 2023
Context:
- Recently the World Intellectual Property Organization (WIPO) has released the World Intellectual Property Indicators (WIPI) for 2023.
|
About the World Intellectual Property Organization (WIPO):
|
Key findings of the report:
- It focuses on global economic conditions and their impact on intellectual property (IP).
- Despite economic uncertainty, a record-high of nearly 3.5 million patent applications were submitted worldwide.
- In 2022, 13 out of the top 20 offices experienced an increase in the number of patent applications compared to 2021.
- Noteworthy growth was observed in the offices of South Africa (+27.6%), India (+25.2%), and Indonesia (+13.3%) reporting a double-digit growth.
- Trademark filing normalised after a pandemic-linked surge, with a 14.5% decline in application class counts but still over 1.5 times more applications than in 2012.
- Despite a 2.1% decline in designs, there is a longer-term growth trend.
- In 2022, innovators from around the world submitted a record-breaking 3.46 million patent applications – the highest number of filings ever recorded.
- Patent applications filed worldwide grew by 1.7% in 2022, marking a third consecutive year of growth.
- Non-resident applicants accounted for 57.5% of total applications filed in the US, but only 9.6% in China.
- In 2022, offices located in Asia received around 68% of patent applications filed globally, marking an increase of 11.9 percentage points on their share a decade earlier in 2012.
|
Patent filings since 1883
Trademark applications filed since 1883
|
SULPHUR DIOXIDE EMISSIONS
Context:
- A study found that the reduction in the planet's sulphur dioxide emissions could be behind the recent spike in global warming.
About Sulphur dioxide (SO2):
- It is a foul-smelling toxic gas that is emitted by the burning of fossil fuels or other materials that contain sulphur.
- Sources of SO2: SO2 is in emissions from power plants, metals processing and smelting facilities, and vehicles. Diesel vehicles and equipment were a major source of SO2, but federal regulations to reduce the sulphur in diesel fuels has significantly lowered emissions.
- Like nitrogen dioxide, sulphur dioxide can create secondary pollutants, such as sulphate aerosols, particulate matter, and acid rain, once released into the air.
- Anthropogenic SO2 emissions typically settle in the troposphere, the lowest part of the atmosphere, with the upper boundary being 10-18 km from the Earth’s surface. The pollutant here is short-lived, lasting only about two weeks.
- However, natural SO2 emissions have a bigger impact because they reach the stratosphere, a layer of atmosphere stretching from 10 km to 50 km above Earth’s surface.
- One example of natural SO2 emission was seen in 1991, when Mount Pinatubo in the Philippines erupted and released 15 million tonnes of the gas, causing a global temperature fall of 0.6˚C over the next 15 months.
Human health and environmental concerns
- Acid rain can damage trees and plants, inhibit plant growth, and damage sensitive ecosystems and waterways.
- Sulphur dioxide also contributes to the formation of thick haze and smog.
- Sulphur dioxide contributes to respiratory illness by making breathing more difficult, especially for children, the elderly, and those with pre-existing conditions.
- Longer exposures can aggravate existing heart and lung conditions.
Monitoring, Reporting, and Regulations:
- Sulphur dioxide is one of six common air pollutants called ‘Criteria Pollutants’, that are subject to primary and secondary National Ambient Air Quality Standards.
- Other five are: Particulate Matter (PM), Ozone, Carbon Monoxide, Nitrogen Dioxide and Lead.
- Primary standards define the air quality required to prevent adverse effects on human health; secondary standards are set to prevent adverse impacts on the environment.
- Minnesota is currently in compliance with national standards for all six criteria pollutants.
- The International Maritime Organization (IMO) is responsible for prevention of marine and atmospheric pollution by ships — enforced reduction of sulphur content in shipping fuels from 3.5% to 0.5%.
- 13 % of the world’s SO2 emissions come from shipping.
Do you know?
|
Solutions:
- The only viable solution is to cap temperature increase by lowering GHG emissions, which have risen by 1.2% from 2021 to 2022 to reach a new record of 57.4 gigatonnes of CO2 equivalent.
- The UN Environment Programme’s Emissions Gap Report 2023 highlighted that CO2 emissions from fossil fuel combustion and industrial processes are the largest contributor, accounting for about two-thirds of current GHG emissions.
- The Sixth Assessment Report (AR6) of the IPCC recommends reducing Methane, Oxides of Nitrogen (NOx) and Volatile Organic Compounds (VOCs) to partially balance the loss in cooling from lowered aerosols.
GROSS ENVIRONMENT PRODUCT (GEP) INDEX
Context:
- GEP Index is the first-of-its-kind index to evaluate Gross Environment Product.
Background:
|
About Gross Environment Product (GEP):
- GEP as a concept was introduced in 2011 by the Himalayan Environmental Studies and Conservation Organization (HESCO) in Dehradun, Uttarakhand. It helps in assessing environmental health based on four pillars: forest, water, air and soil.
- Uttarakhand, in 2021, announced that it would be the first state to introduce it to address shortcomings and measure the growth of the environment along with development.
- It aims to assess the growth and health of natural resources, and the positive or negative impact that human activities have on them.
- Uttarakhand is currently working on formulating a GEP Index.
Status of Forests:
- The Forest-GEP Index looks at the ecological significance of forests beyond the traditional focus on timber production.
- It aims to quantify human efforts to enhance forested regions by introducing climate resilient trees that contribute to ecological functions.
Status of Water:
- The Water-GEP Index critically assesses the overall status of water resources. It aims to assess human and governmental action to improve water quality and quantity, like rainwater harvesting through ponds, check dams and water holes.
Status of Air:
- The air quality index is already measured across countries, and is represented as a numerical value determined by monitoring concentrations of pollutants such as particulate matter, nitrogen dioxide and sulphur dioxide.
- The index ranges from 0 to 500, where higher values indicate poorer air quality.
Status of Soil Health:
- The Soil-GEP index examines the impact of land management practices on soil health and its ability to deliver essential ecosystem services such as fostering plant growth, facilitating nutrient cycling, purifying water and sequestering carbon.
- These services are impacted by the application of chemical fertilisers, deforestation and rampant urbanisation.
CHILD POVERTY
Context:
- The World Bank and UNICEF recently estimated that every second extreme poor individual in the world is a child, surviving on less than US$2.15 a day.
About:
- A poor child is usually an indicator of his or her household’s economic condition.
- The World Bank and UNICEF found that 333 million children (under 18 years of age) grew up in extreme poverty in 2022, which added more children to poverty than adults.
- It is not a sign of escaping poverty.
- Inequalities in income and wealth are often talked about globally, their impact on children has not been studied much.
- Extreme child poverty is more prevalent in poor and least developed countries, mostly in Africa and Asia.
- In 2022, sub-Saharan Africa accounted for 75% of the world's child population living in extreme poverty.
- The ‘Child Poverty in the Midst of Wealth’, a report released by UNICEF, shows that child poverty is widely prevalent in the high-income and upper middle-income countries of the EU and the Organisation for Economic Co-operation and Development (OECD).
- With the Sustainable Development Goals (SDGs), nations agreed for the first time in history to end extreme child poverty.
- The SDGs call for multidimensional child poverty – a measure of poverty that goes beyond income – to be halved by 2030, building a world in which all children have what they need to survive, thrive and fulfil their potential.
Impact of COVID-19 Pandemic:
- Child poverty is on a decline but the COVID-19 pandemic put a brake on this progress.
- Extreme child poverty has decreased in almost all regions of the world between 2013 and 2022, with the most significant decrease in the East Asia and Pacific and South Asia regions, according to the assessment.
- Some 63.3 million children have escaped poverty during 2013-2019.
- In 2021, the child poverty again started reducing but not at the rate that of pre-pandemic years.
- In the absence of COVID-19 we would have expected a reduction of 68.4 million children in extreme poverty between 2013 and 2020, but only actually witnessed an estimated reduction of 29.2 million children, due to pandemic disruptions, says the assessment.
Way Ahead:
- Persisting child poverty decisively impacts the global goal to eradicate extreme poverty, a promise made under SDG 1.
- With the right investments and will, there is a way to lift millions of children out of what is often a vicious cycle of poverty.
- It is more critical than ever that all children have a clear pathway out of poverty, through equitable access to quality education, nutrition, health and social protection, as well as safety and security.
PRELIMS FACTS
FOUR-HORNED ANTELOPES
Context:
- Recently more than a dozen four-horned antelopes, also known as Choisingha, in the Nandanvan Jungle Safari Zoo of Nava Raipur, Chhattisgarh were reported dead.
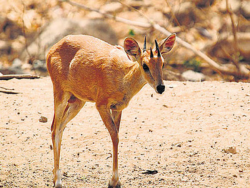
About the four-horned antelopes:
- These are endemic to India and Nepal inhabiting open dry deciduous forests.
- These are identified by the presence of four horns that are present only in adult males.
Threats and Conservation Status
- Major threats to the species include habitat destruction, poaching and competition with livestock.
- Wildlife Protection Act (1972): Schedule I
- International Union for Conservation of Nature (IUCN) Red List of Threatened Species: Vulnerable
PROVISIONAL STATE OF THE GLOBAL CLIMATE REPORT (2023)
Context:
- The Provisional State of the Global Climate report for 2023 was launched by the World Meteorological Organization (WMO) during COP 28.
Key Findings:
- 2023 is set to be the warmest year on record. Data until the end of October shows that the year was about 1.40 degrees Celsius above the pre-industrial 1850-1900 baseline, with a margin of uncertainty of ±0.12°C.
- The past nine years, 2015–2023, will be the nine warmest years on record.
- Record monthly global temperatures have been observed for the ocean and the land.
- The ten-year average 2014–2023 global temperature is the warmest 10-year period on record.
- Observed concentrations of the three main greenhouse gases – carbon dioxide, methane, and nitrous oxide – reached record high levels in 2022.
- Ocean heat content reached its highest level in 2022.
- In 2023, global mean sea level reached a record high, reflecting continued ocean warming as well as the melting of glaciers and ice sheets.
- Antarctic sea-ice extent reached an absolute record low for the satellite era in February.
- Extreme weather continues to lead to severe socio-economic impacts, including loss of life, destruction of homes, large-scale air pollution, and displacement of populations.
THE GLOBAL DROUGHT MAP
Context:
- The United Nations, during COP28, launched the Global Drought Map to provide information about drought conditions around the world.
About the Global Drought Map:
- It uses the Standardised Precipitation Index (SPI) to measure how observed precipitation deviates from the climatological average over a given time period.
- The map shows both Dry (D) and Wet (W) conditions.
- Dry and Wet conditions are categorised into five levels:
-
- D0/W0 (abnormally dry/wet);
- D1//W1 (moderate drought/wet);
- D2/W2 (severe drought/wet);
- D3/W3 (extreme drought/wet); and
- D4/W4 (exceptional drought/wet).
- In 2022-23, at least 23 countries, including India, declared drought emergencies at a national or sub-national level.
- The countries affected by drought faced significant impacts, including economic losses, loss of agriculture and livelihood, and potential disruptions to global food supply chains.
Significance:
- The Global Drought Map serves as a wake-up call to the increasing severity and frequency of droughts due to climate change.
- It’s important to note that droughts have far-reaching impacts, affecting not just humans but also ecosystems
- It adds that 1.84 billion people were drought-stricken, 85% of whom were in middle and low income countries.
SOCIAL COST OF CARBON
Context:
- The increase in the global social cost of carbon due to long-term impacts of tropical cyclones.
About the Social Cost:
- These are future costs of societies from emission of one additional tonne of carbon dioxide.
- Extreme weather events can hinder economic development, increasing this cost.
Tropical cyclones and its social cost:
- They affect on average 20.4 million people annually, and they cause direct annual economic losses of US$ 51.5 billion averaged over the last decade.
- The long-term reductions in economic growth may harm economic development even more strongly than the direct loss and damage caused by the cyclone landfalls.
- These long-term effects are not accounted for in current estimates of the social cost of carbon.
- A study found that accounting for the impacts of tropical cyclones increases the global social cost of carbon by more than 20%.
- This increase is mainly driven by the strongly affected major greenhouse gas emitting countries India, USA, China, Taiwan, and Japan.
- The projected increase in the frequency of the most intense tropical cyclones under global warming may render overlapping economic repercussions more likely, amplifying long-term growth losses in the absence of additional adaptation measures.
RENEWABLE ENERGY TRACKER 2023
Context:
- The Climate Action Network (CAN), the Platform of Action for Renewable Energy, launched the ‘Renewable Energy Tracker (2023)’ recently.
About:
- The ‘Renewable Energy Tracker (2023)’ is an assessment of countries’ progress towards 100% renewable energy systems.
- It says countries are not on track to reach 100% renewable energy systems, as per targets set by the International Energy Agency (IEA).
- It is driven by principles of equity & fairness, acknowledging differences between countries in terms of priorities, financial abilities, population size and common but differentiated responsibilities.
- It puts emphasis on rewarding countries that are performing consistently better than others across the majority of indicators assessed, looking at deployment in the power sector and economy-wide, investments, co-benefits, etc.
- It covers 60 countries representing 85% of total population and accounting for about 90% of total greenhouse gas emissions, energy use and GDP.
Key Findings:
- Countries are rated as Champions, Frontrunners, Moderates, Trailers or Slow-starters.
- No countries are performing consistently better than others, leaving the Champion category empty.
- The top 3 places are occupied by three Emerging and Developing Economies (EMDEs): Chile, Brazil and China.
- A number of EMDEs are doing better than advanced economies from an equity perspective: Vietnam, Colombia, Jordan, India, Mexico and Malaysia all rank among the top 20.
- A number of advanced economies are lagging behind and not living up to their capabilities and responsibilities. Five high-income countries that are members of the G20, accounting for almost 9% of global GHG emissions, are among the Trailers and Slow-starters: Japan, Canada, South Korea, Saudi Arabia and Italy.
- Despite the equity-based indicators, sub-saharan African countries are at the bottom of the ranking, emphasising one more time the urgent need for significant funding from richer OECD countries to lower income countries.
LANTANA CAMARA
Context:
- A decade-long initiative in Madhya Pradesh to reclaim land overrun by lantana helps residents restart agriculture and restore native biodiversity.
About:
- Lantana camara, also known as lantana, is an invasive weed species of flowering plant within the verbena family.
- It is native to the American tropics and is a very adaptable species that can inhabit a wide variety of ecosystems.
- Lantana is not native to India, and was introduced in the country as an ornamental plant by the British in the 1800s, and has since spread over 574,186 sq km, covering 50% of the country’s ‘natural areas’.
- It has invaded more than 40% of India’s tiger habitats, threatening them by reducing the tiger’s prey base.
- The Wildlife Institute of India (WII) revealed that Lantana camara has invaded 154,000 square kilometres, nearly the size of Odisha.
- In Karnataka, nearly half of the Bandipur Tiger Reserve is covered with Lantana camara and other invasive species.
- The Shivalik hills, Central India, and Southern Western Ghats are the worst hit.
Concern:
- Eradicating lantana is difficult because of its rapid spread, intensity of infestation, allelopathy [chemicals released to discourage growth of native plants], opportunistic growth behaviour, reproductivity biology traits, and tenacious resistance to cutting and burning.
Solutions:
- In every Tiger Reserve, a few hectares of land is cleared of lantana each year, but the area requires intensive surveillance, and requires consistent management.
- Lantana regrows rapidly, and hence a follow-up removal of lantana seedlings is necessary.
- These invasive species can be used as biofuel and could be gasified.
GLOBAL SCIENCE FESTIVAL
Context:
- Recently, Kerala hosted the Global Science Festival Kerala (GSFK) for 2024.
About the Global Science Festival Kerala (GSFK):
- It is Asia's largest thematically curated science exhibition.
- It is a joint initiative of the Government of Kerala’s Science and Technology Department, Kerala State Council for Science, Technology and Environment and A Museum Art Science.
- It is open at Bio 360 Life Sciences Park in Thiruvananthapuram in Kerala.
- It is a unique platform that aims to bring together scientists, artists, students, and science enthusiasts worldwide to celebrate science.
Objectives:
- Foster the community as a knowledge society, promote scientific reasoning and propagate science’s philosophy, methodology and objectivity.
- Create a platform for scientists, scholars, and the public to interact with each other and recontextualize science as a way of life.
- Celebrate the fusion of science and art with an interdisciplinary approach to better science communication.
Significance:
- Events at the festival will focus on the fusion of science and art, including a 720, three-dimensional installation of the universe, immersive programmes on neuroscience, climate change and virtual reality, street displays and public lectures.
SUBJECTIVE QUESTIONS
- Examine the methodology and forecasting system of drought prone regions in India.
- Discuss the challenges associated with the Urban floods in India. Suggest measures to mitigate these floods.
- Analyse the spatial pattern of extreme weather events in India. What are the consequences of these weather events?
- Identify the ways how far climate change could increase the frequency and strengths of extreme weather events.
- Define the terms like Loss and Damag, Climate Finance, Global Goal on Adaptation (GGA)’ and ‘Global Stocktake in context of 28th Conference of Parties (COP28), and outline the challenges associated?
QUICK LINKS